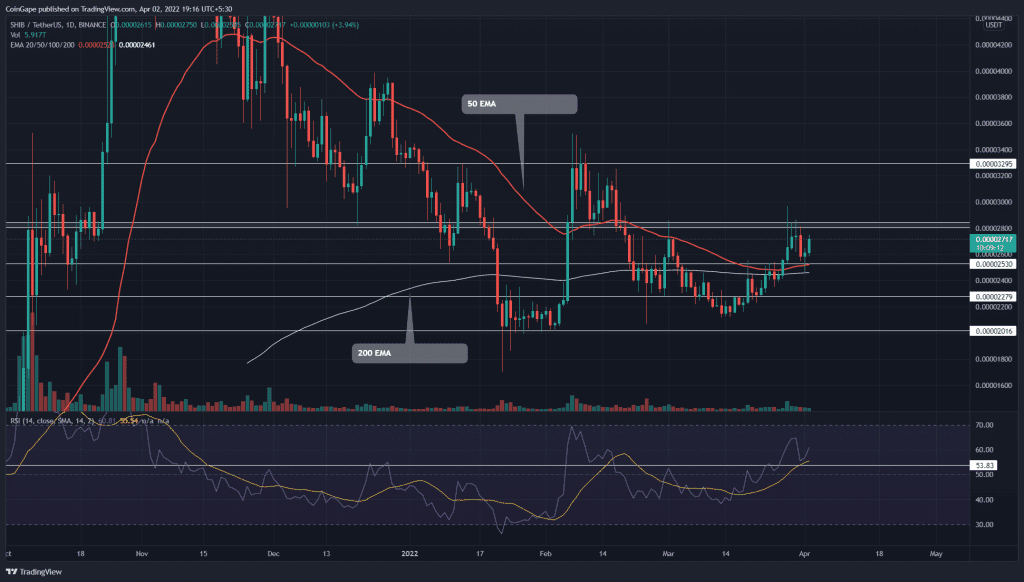
A minor pullback from the $0.000028 resistance tumbled the Shiba Inu(SHIB) price by 10%, hitting the $0.000025 mark. However, the buyers defended this flipped support and rebounded the price with a morning star candle. The SHIB price approaching the overhead resistance($0.000028) could provide a breakout opportunity.
Key points:
- SHIB price shows sustainability above the 200-day EMA
- The daily-RSI indicators surpass their previous swing high
- The intraday trading volume in the Shiba Inu coin is $1.2 Billion, indicating an 18.5% drop.
Source- Tradingview
The SHIB/USDT pair showcased recovery signs from the second half of March as memecoin breached the $0.0000228 resistance. The post-retest rally accelerated the bullish momentum and pumped the altcoin 23.3% high to $0.000028.
The buyers made several attempts to pierce this resistance, but the aggressive sellers forced every candle to close below the $0.000028 mark, resulting in a bearish reversal. However, the sellers couldn’t pressurize the buyers for long as the combined support of $0.000025 and a cluster of EMAs(20, 50, 100, and 200) rebounded the altcoin with a morning star candle.
Today, the NEAR price is up by 4.2% and gradually approaches the overhead resistance. A bullish breakout and closing above the $0.000028 level would indicate the traders are buying on dips, providing the next target 15.5% high at $0.0000327.
Alternatively, if the sellers maintain a stiff resistance at $0.000028 resistance, a possible reversal could violate the $0.000025 support this time.
Technical indicator
Concerning the previous swing high of $0.000028, the relative strength index(66) slope has surged higher into the bullish territory, suggesting an increase in buyer strength.
The bullish recovery has overcome a cluster of EMAs(20, 50, 100, and 200) at the $0.000025 mark. These EMAs lines reverted the recent pullback, indicating the prior resistance is flipped to support.
- Resistance levels- $0.000028, and $0.000033
- Support levels are $0.0000253 and $0.00002288


