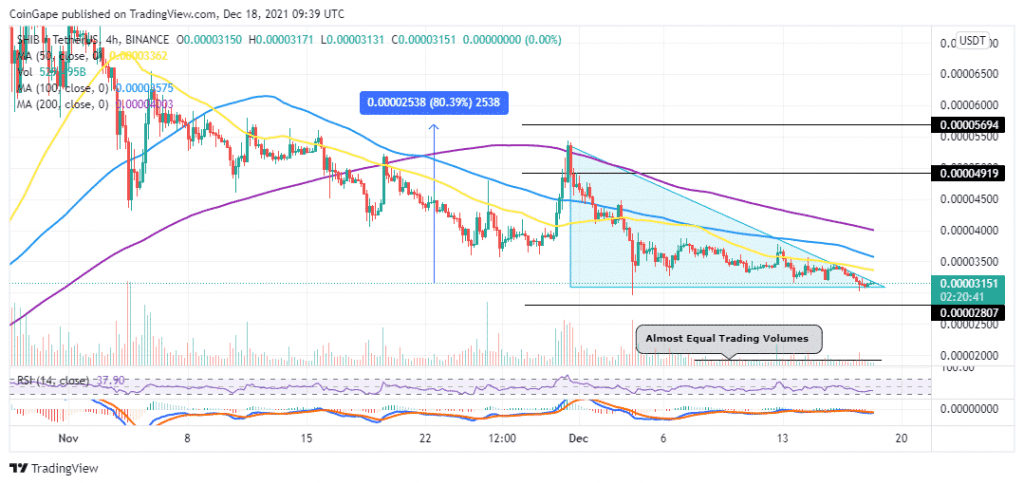
Shiba Inu (SHIB) price pushes higher against the descending trendline of the descending triangle. This bearish triangle has kept the Shiba Inu price action on a downward trend since the beginning of December. As the SHIB price battles overhead resistance from the triangle’s descending trendline, expect a price surge if Shiba Inu breaks above it. If this happens, it will bolster the “SHIB Army” to push the price towards the $0.00004919 level before going for the $0.00005694 level.
Shiba Inu Price Could Rally 80%, After Breakout
The SHIB price action appears to have formed a descending triangle on the four-hour chart which appears to have triggered today. The triggering of the triangle points to a price consolidation that might take place in either direction.
The price consolidation is validated by the flattening moving averages and the almost equally four-hour period trading volumes.
Moreover, the horizontal movement of the Relative Strength Index (RSI) and the Moving Average Convergence Divergence (MACD) indicator adds validates Shiba Inu’s price consolidation without any clear direction that the “Dogecoin Killer” could take.
At the time of writing, Shiba Inu price is hovering around $0.00003151 and if it favours the bulls and rises above the downtrend line of the triangle, we could see an explosion of buying volume with sidelined investors jumping on the bullish signal.
If this happens, SHIB could first rise to re-test the $0.00004919 resistance level. After which, a rise to towards the $0.00005694 level would be the next logical move, an 80% rise from the current price.
SHIB/USD Daily Chart
On the flip side, if Shiba Inu price favours the bears and drops below the triangle’s horizontal trendline at $0.00003094 level, it could trigger massive sell orders that are likely to pull SHIB down to tag the $0.00002807 level. A drop further could see the Shiba Inu price drop towards the $0.000020 psychological level.
Note that the position of the MACD below the zero line in the negative region accentuates this bearish outlook.
In the meantime, investors have to wait to see which direction the meme coin will take as it consolidates within the confines of the triangle.


