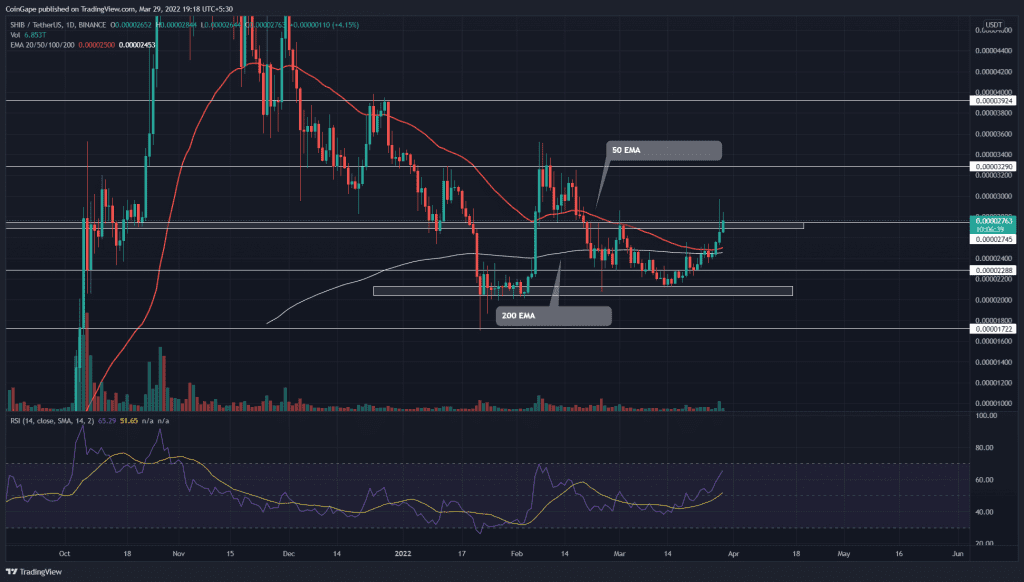
The Shiba Inu(SHIB) buyers were struggling to overcome a $0.0000273 resistance, which resulted in a long-tail rejection candle on March 29th. However, the uncertainty resolved, and the buyers reattempted to breach the overhead resistance with today’s long bullish candle.
Key points:
- The positive crossover among the 20-and-50 EMA encourages the ongoing rally
- The $0.0000293 breakout hints at another 20% rally.
- The intraday trading volume of the Shiba Inu coin is $3.9 Billion, indicating a 162.9% gain.
Source- Tradingview
The SHIB price started a new recovery rally on March 16th, after spending the first half of March in decline. The bulls knocked out a series of resistance on their ways, such as $0.000023, $0.000025, and 200-day EMA.
On March 29th, the coin chart displayed a long-tail candle closing below the $0.0000273 resistance. However, even after facing strong rejection, the buyers regrouped and breached the overhead resistance again. Anyhow, the long traders should wait for the daily candle closing above $0.0000273 to confirm an honest breakout.
If the buyers succeeded, the bullish momentum would continue to grow, suggesting the next target of 18% at $0.000033.
Alternatively, if the sellers pull the altcoin below $0.0000273 again, the second long-wick rejection would indicate an intense supply pressure and plunge the coin price to $0.0000231.
Technical indicator
The relative strength index(66) continues to rally higher with no signs of reversal yet.
The bullish recovery has regained the important EMAs(20, 50, 100, and 200) lines. In addition, the coin price has recently pierced the 100-day EMA, which assists buyers in the possible retest.
- Resistance levels- $0.0000323, and $0.000039
- Support levels are $0.000025 and $0.00002288


