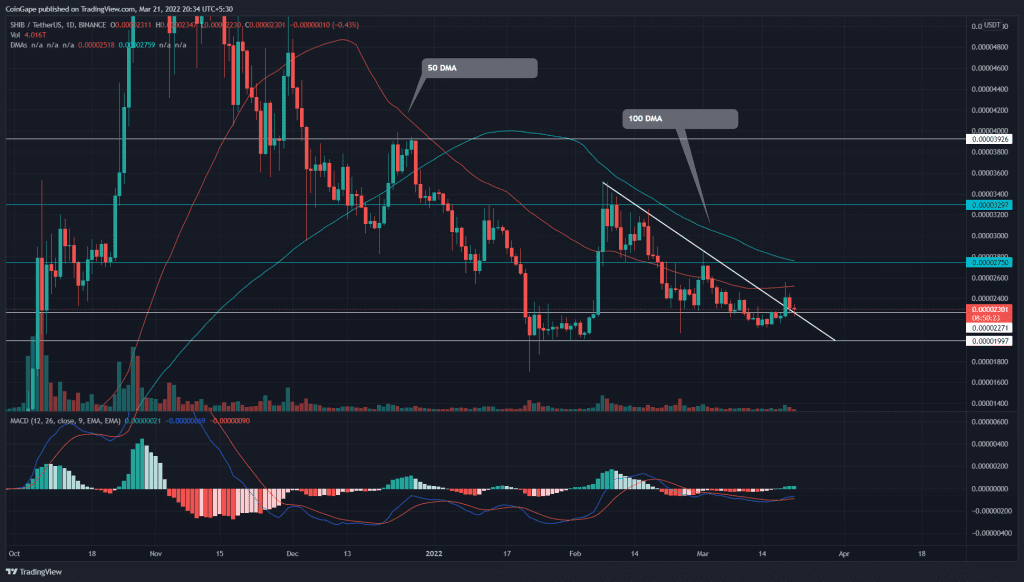
A descending trendline initiated from February top($0.000035) carried the recent short-term downtrend in Shiba Inu(SHIB). The memecoin lost 40% by hitting the $0.0000206 mark. However, the recent price jump has poked the dynamic resistance indicating a potential rally to $0.000033 monthly resistance.
Key points:
- The SHIB price shows long-tail Doji candle at breached resistance
- Post retest rally could spike SHIB price by 42%
- The intraday trading volume in the Shiba Inu coin is $659.3 Million, indicating a 0.11% gain.
Source- Tradingview
On March 10th, the SHIB sellers shattered the $0.000022 weekly support, teasing to revisit the January bottom support at $0.00002. The traders spent a whole week to sustain below breached support; however, 189.7 million $SHIB burned on March 19th triggered an 8% pump.
The long bullish candle breached $0.000022 flipped resistance and descending trendline, indicating a support fakeout. This bear trap could escalate the bullish momentum and kick-start a new recovery opportunity for SHIB holders.
A retest to the breached resistance shows a long-tail rejection candle, suggesting the buyers accept it as valid support. A potential rally could soar by 42%, hitting the $0.000033 mark.
Contrary to the bullish assumption, if buyers couldn’t sustain above the descending trendline and drop the altcoin below the $0.000022.
Technical Indicator
The flattish 50 DMA could interrupt the bullish attempt to sustain $0.000022. However, the altcoin trading below crucial DMAs(50, 100, and 200) suggests the traders could find the path to least resistance downward.
The MACD indicator performs a bullish crossover in the bearish territory, providing an additional confirmation to trendline breakout.
- Resistance levels- $0.0000275, and $0.000023
- Support levels are $0.000022 and $0.00002.


