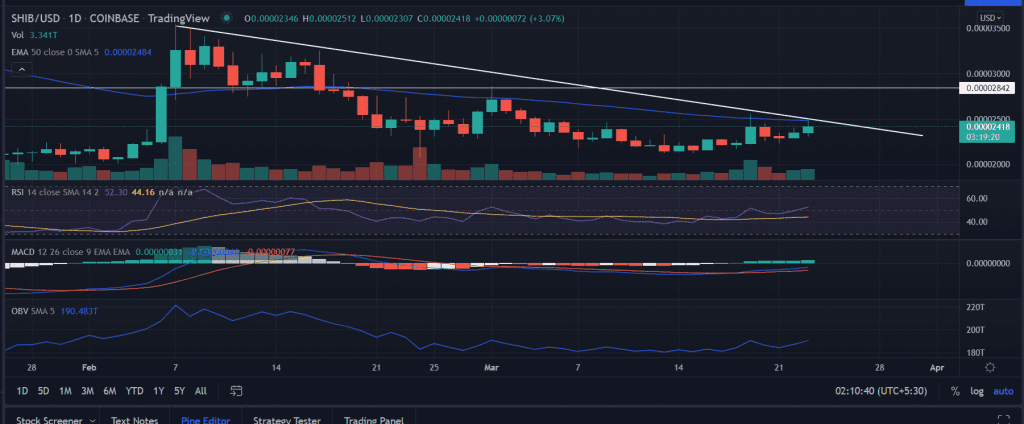
SHIB price manages to collect gains as bulls are back after the short backslide from Monday. The price once again visits the 50-day SMA at $0.000024 since Saturday. This shows the growing interest of bulls in the token after bottoming out near $0.000020.
- SHIB price trades higher for the second straight day.
- More gains towards February swing highs at $0.000035 if closes above 50-day SMA on a daily basis.
- SHIB price attains the vital $0.000025 mark amid renewed buying interest.
SHIB price set to explode
On the daily chart, the SHIB price remains pressured near the descending trend line, which is extending from the highs of $0.000035 highs made on February 7. The bearish slopping line acts as a strong upside barrier for the price. This also coincides with the crucial 50-day SMA. Thus, making $0.000025 a crucial level to trade.
A daily acceptance above the mentioned level will hint at the buying interest among investors. In that scenario, more gains are expected in the coming few sessions toward the ultimate target at $0.000035.
However, before that milestone, SHIB price must break a few upside filters to take out the final target. The first resistance is found at the $0.000028 level horizontal resistance level followed by the highs of February 17 at $0.000032.
On the flip side, a failure to move beyond the bearish trend line would mean bulls are not convinced or willing to extend the gains further. A shift in the bullish sentiment might result in re-testing of the support near $0.000022.
Technical indicators:
RSI: The daily Relative Strength Index pierced above the average line on March 18 and continued to trade higher. The current reading is at 52 with a bullish bias.
MACD: The Moving Average Convergence Divergence still lingered below the midline. An uptick in the indicator would support the upside bias.
Trading Volumes: The On Balance Volume (OBV) showed the rising prices supported by the increased demand.


