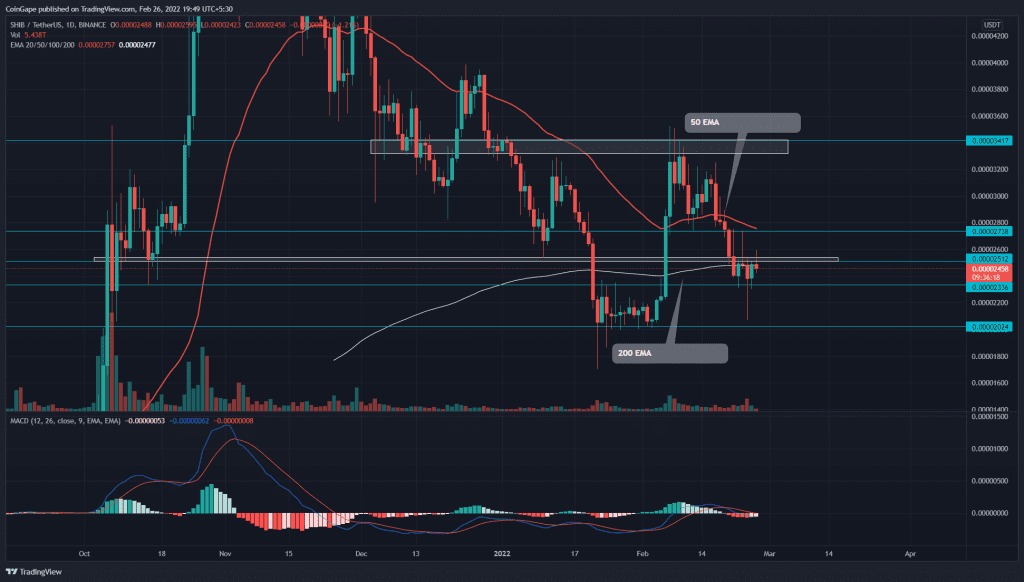
Amidst geopolitical issues like the Russia-Ukraine war, the Shiba Inu (SHIB) price shows robust volatility over the past few days. The seller had recently slumped the coin price to a prior support level of $0.0000236. However, both parties are struggling to make significant moves, forming a no-trading zone for traders.
Key technical points:
- The SHIB chart shows higher price rejection at $0.000025 resistance
- The intraday trading volume in SHIBA/USDT is $1.35 Billion, indicating a 44% loss.
Source- Tradingview
Last weekend the Shiba Inu(SHIB) price gave a decisive breakdown from the $0.000025 support, indicating more downside risk. On Feb 23rd, a long-wick rejection candle closed below the $0.000025 mark, indicating the support has flipped to resistance.
The sellers attempted to follow up on the bearish breakdown by poking the $0.0000238 mark. However, intense demand pressure formed a long-tail rejection candle closing above the $0.000238. There the price resonating between these levels indicates a no-trading zone.
The downsloping crucial EMAs(20, 50, and 100) indicate bears are in control. Moreover, the buyers are struggling to sustain above the 200-day EMA.
The Moving average convergence divergence indicator shares a neutral bias as the fast and slow are wavering around the neutral zone(0.00).
SHIB Price Resonates In A Falling Expanding Channel Pattern

Source-tradingview
The 4-hour technical chart displayed a falling expanding pattern. This pattern usually initiates a significant bull run as the price breach the overhead resistance. The breakout would pump the altcoin to $0.000027.
However, the price action showing higher price rejection at this resistance suggests a possible reversal. If the altcoin reverted from this resistance, the sellers would plunge it to the immediate support of $0.000023, followed by a $0.00002
- Resistance levels- $0.000025, and $0.000027
- Support levels are $0.000023 and $0.00002.


