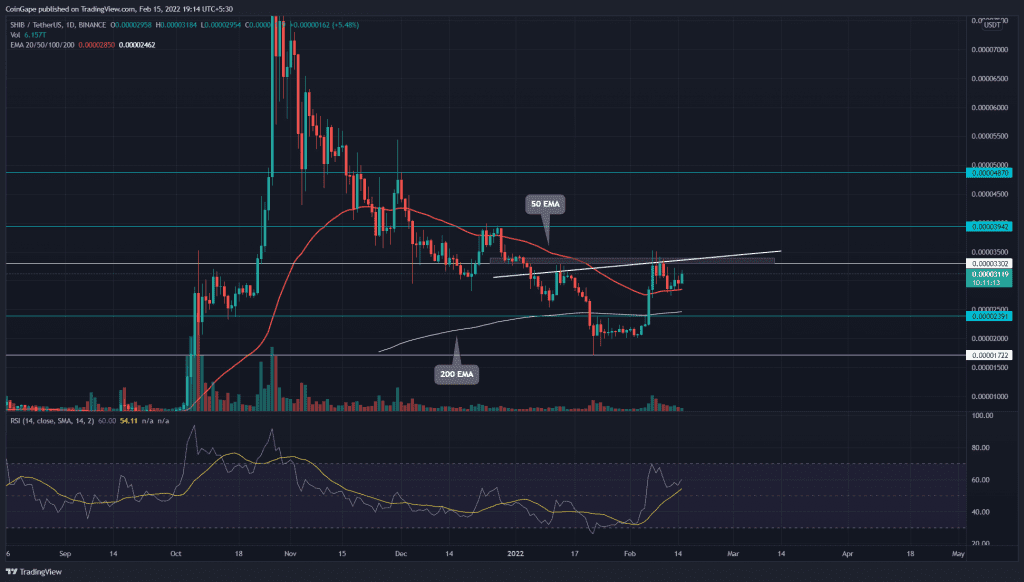
The Shiba Inu (SHIB) price chart showed minor retracement to the $0.000028 mark, after last week’s recovery rally. The buyers found support at the 50-day EMA and rebounds from this level with a morning star candle. The SHIB price forming the right shoulder of inverted head and shoulder projects a bullish opportunity above the $0.000033 mark.
Key technical points:
- The SHIB buyers regain the bullish sequence among the crucial EMAs(20, 50, 100, and 200)
- The SHIB price trading at $0.000031, providing an intraday gain of 5.51%
- The 24-hour trading volume in SHIBA/USD is $1.6 Billion, indicating a 31% gain.
Source- Tradingview
During the first week of February, the SHIB price registered a 70% recovery from the $0.000002 mark. The buyers escaped from the highly influential falling channel, which surged the meme coin to the $0.000033 mark.
The higher price rejection candle at this resistance suggests profit booking from crypto traders, leading to a minor pullback. This retracement plugged the altcoin 18% lower, bringing it to $0.000028.
However, the buyers defended the flipped support of the 50-day EMA and pushed the SHIB price higher. The technical chart shows the formation of an inverted head and shoulder pattern with the neckline at $0.000033.
If buyers could breach this overhead neckline, the meme coin would first rally to the $0.00004 mark. If they overcome this resistance too, the next significant supply region is located at $0.48.
Technical Indicators
The flattish 50-and-100-day EMA and the rising 20-day EMA accentuate the bullish recovery. Moreover, the SHIB price trading above the crucial EMAs indicates the bulls have the upper hand.
The Relative Strength Index(60) slope rallying higher in the positive territory indicates the buyers strengthening their grip.
- Resistance levels– $0.000033, and $0.00004
- Support levels– $0.0000275 and $0.000024.


