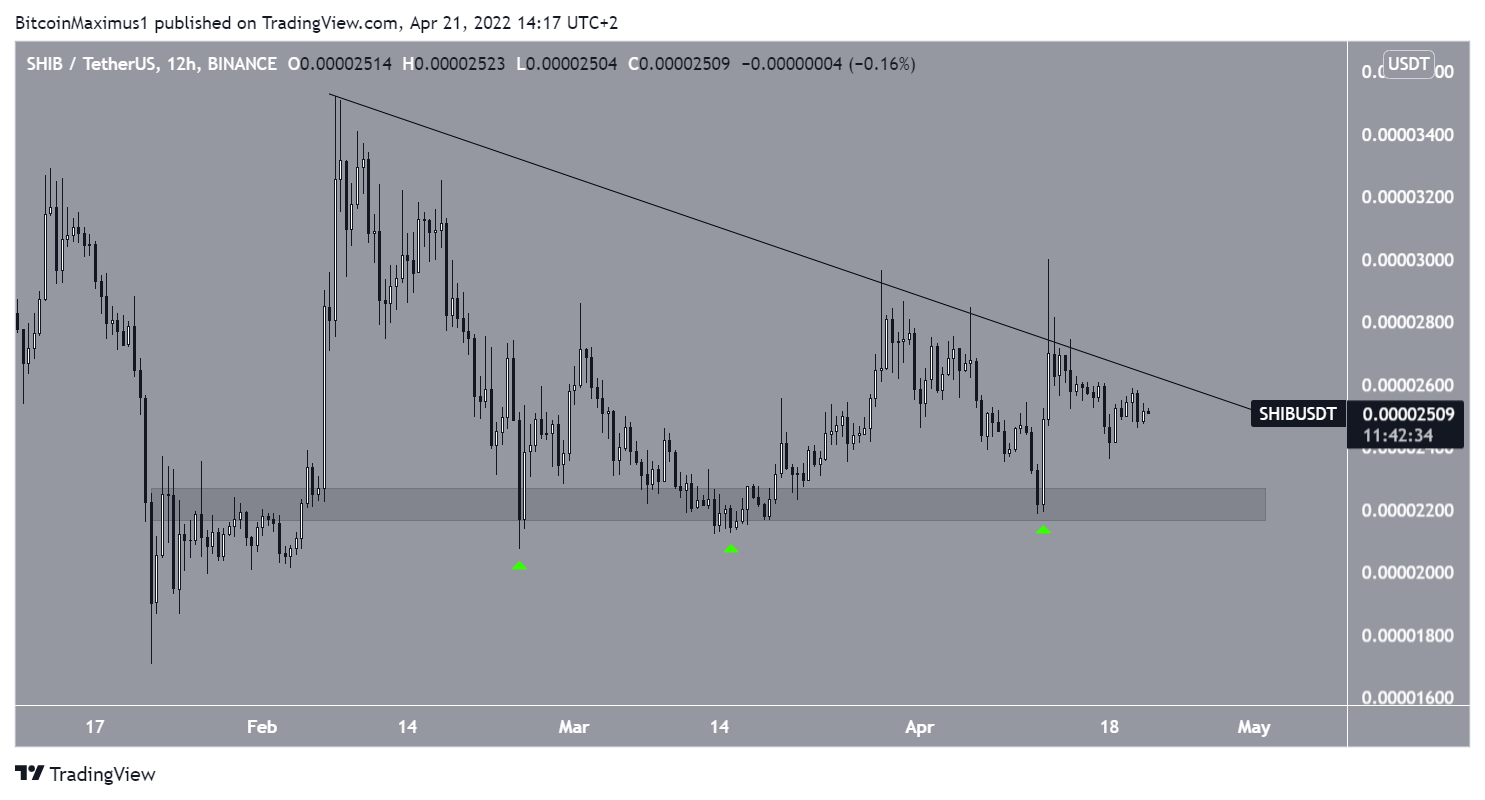
Be[in]Crypto takes a look at the price movement for seven different cryptocurrencies, including Shiba Inu (SHIB), which has made four attempts at breaking out from a descending resistance line.
BTC
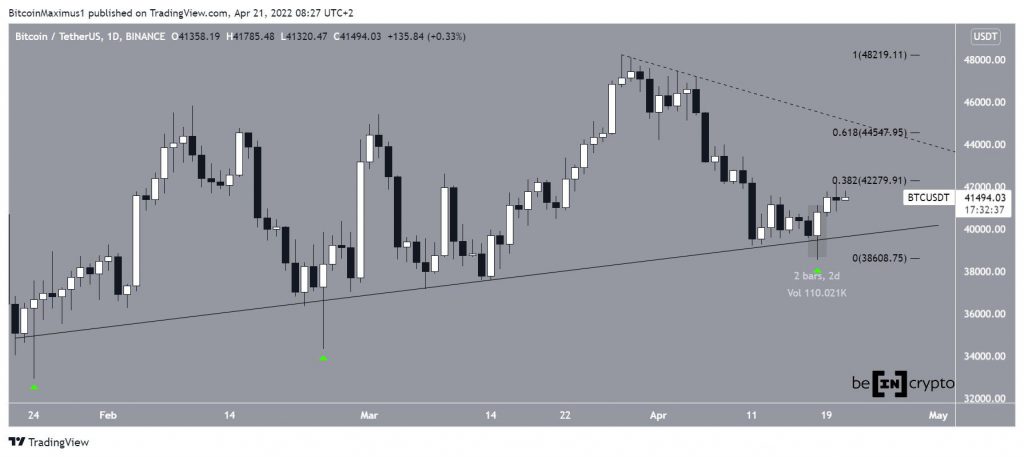
Bitcoin (BTC) has been increasing alongside an ascending support line since Jan 24. More recently, the line was validated on April 18, when BTC created a bullish engulfing candlestick.
The upward movement continued until BTC reached the 0.382 Fib retracement resistance level at $42,279.
If BTC continues moving higher, the next resistance would be at $44,550. This is the 0.618 Fib retracement resistance level and coincides with a descending resistance line (dashed).
ETH
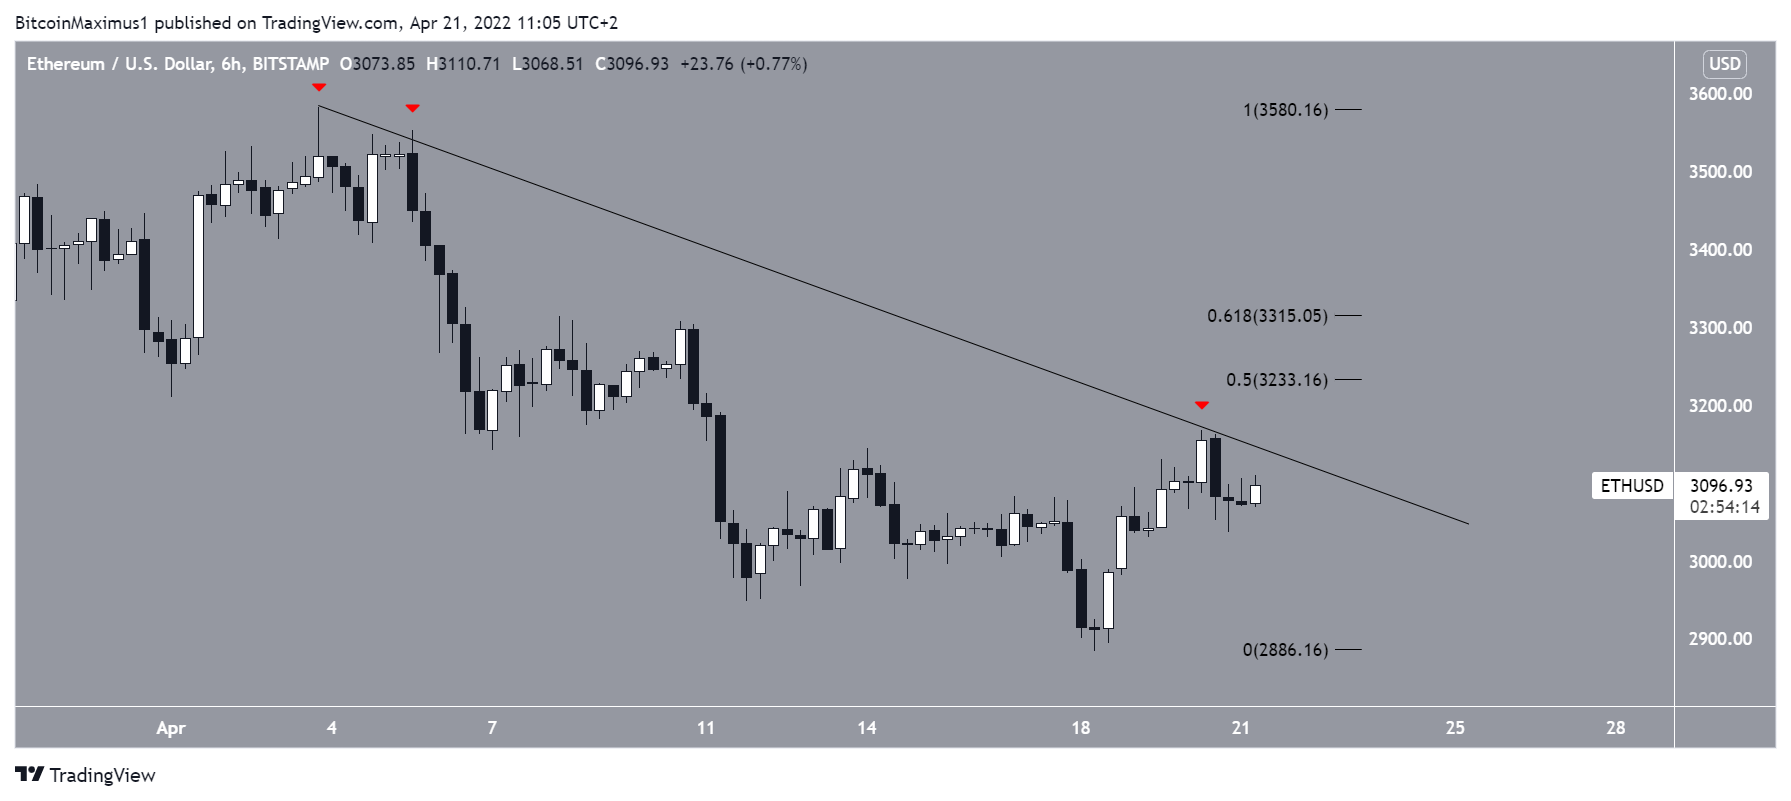
Ethereum (ETH) has been decreasing alongside a descending resistance line since April 3. While doing so, it fell to a low of $2,883 on April 20. So far, the line has rejected ETH thrice (red icons), most recently on April 20.
If ETH were to break out, there is strong resistance between $3,233 and $3,315. This is the 0.5 – 0.618 Fib retracement resistance level. Until ETH manages to clear it, the short-term trend cannot be considered bullish.
XRP
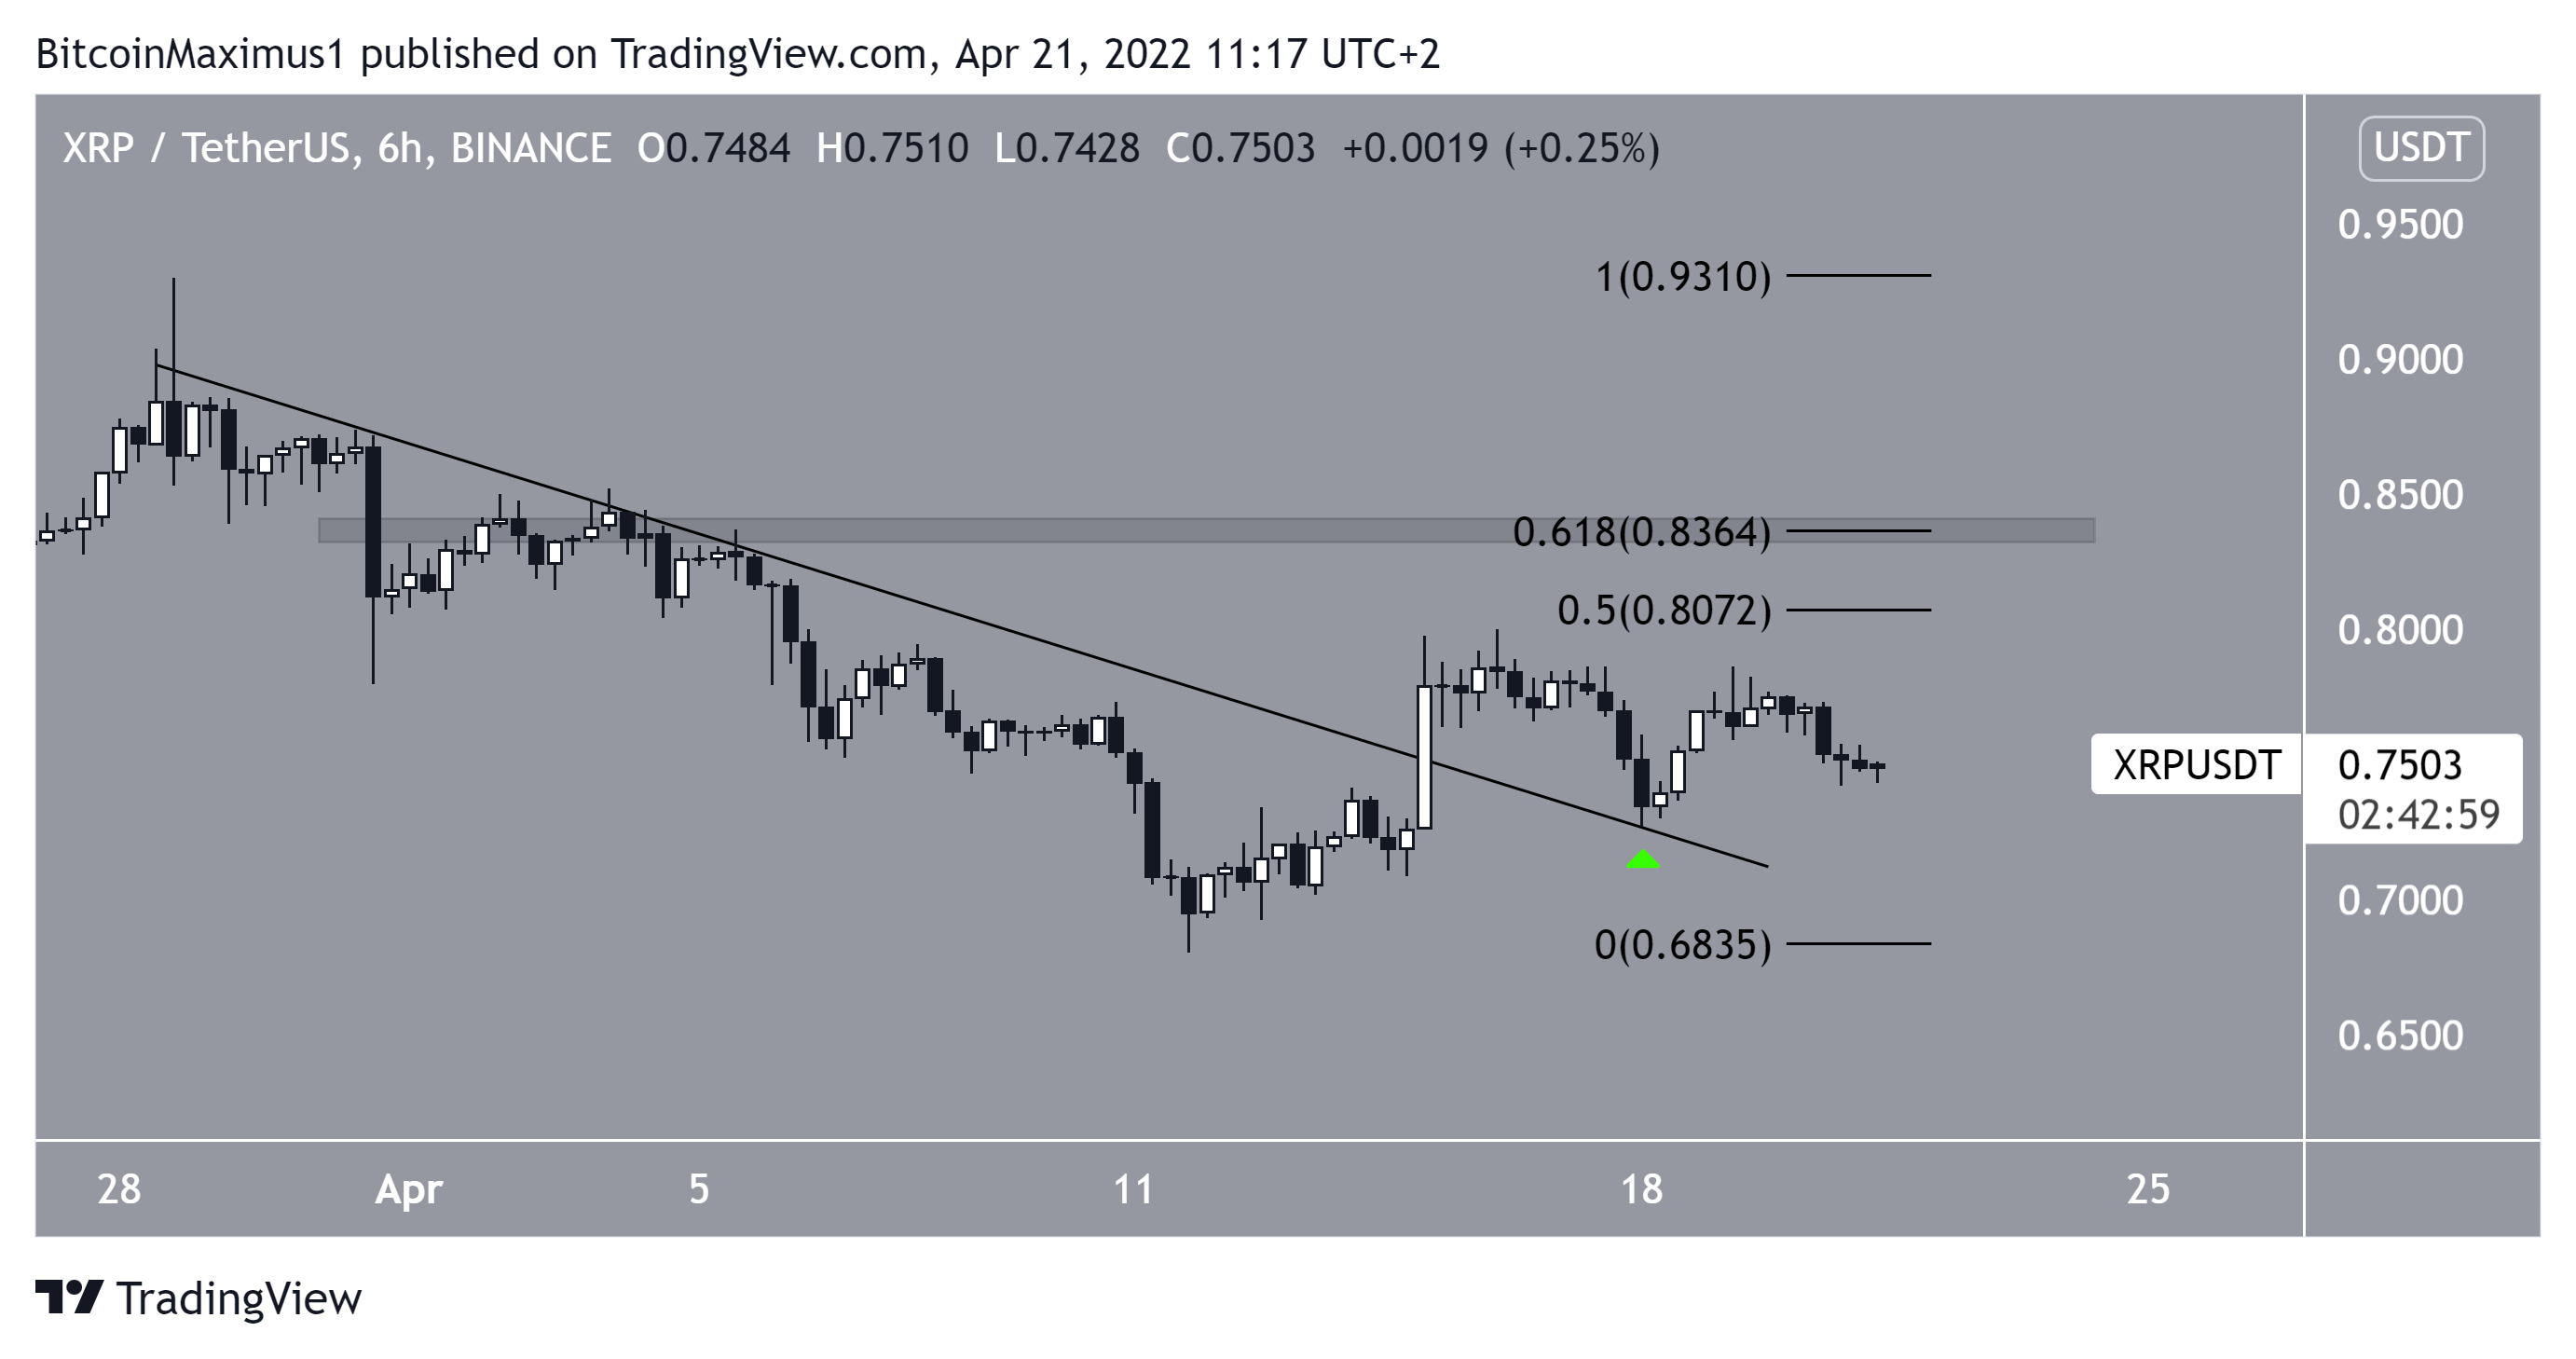
XRP had been decreasing alongside a descending resistance line since March 28. This led to a low of $0.68 on April 11.
XRP began an upward movement afterwards and broke out from the line on April 15. It returned to validate the line as support three days later.
If XRP continues to increase, the two closest resistance levels would be at $0.81 and $0.84. They are the 0.5 – 0.618 Fib retracement resistance levels, respectively.
AVAX
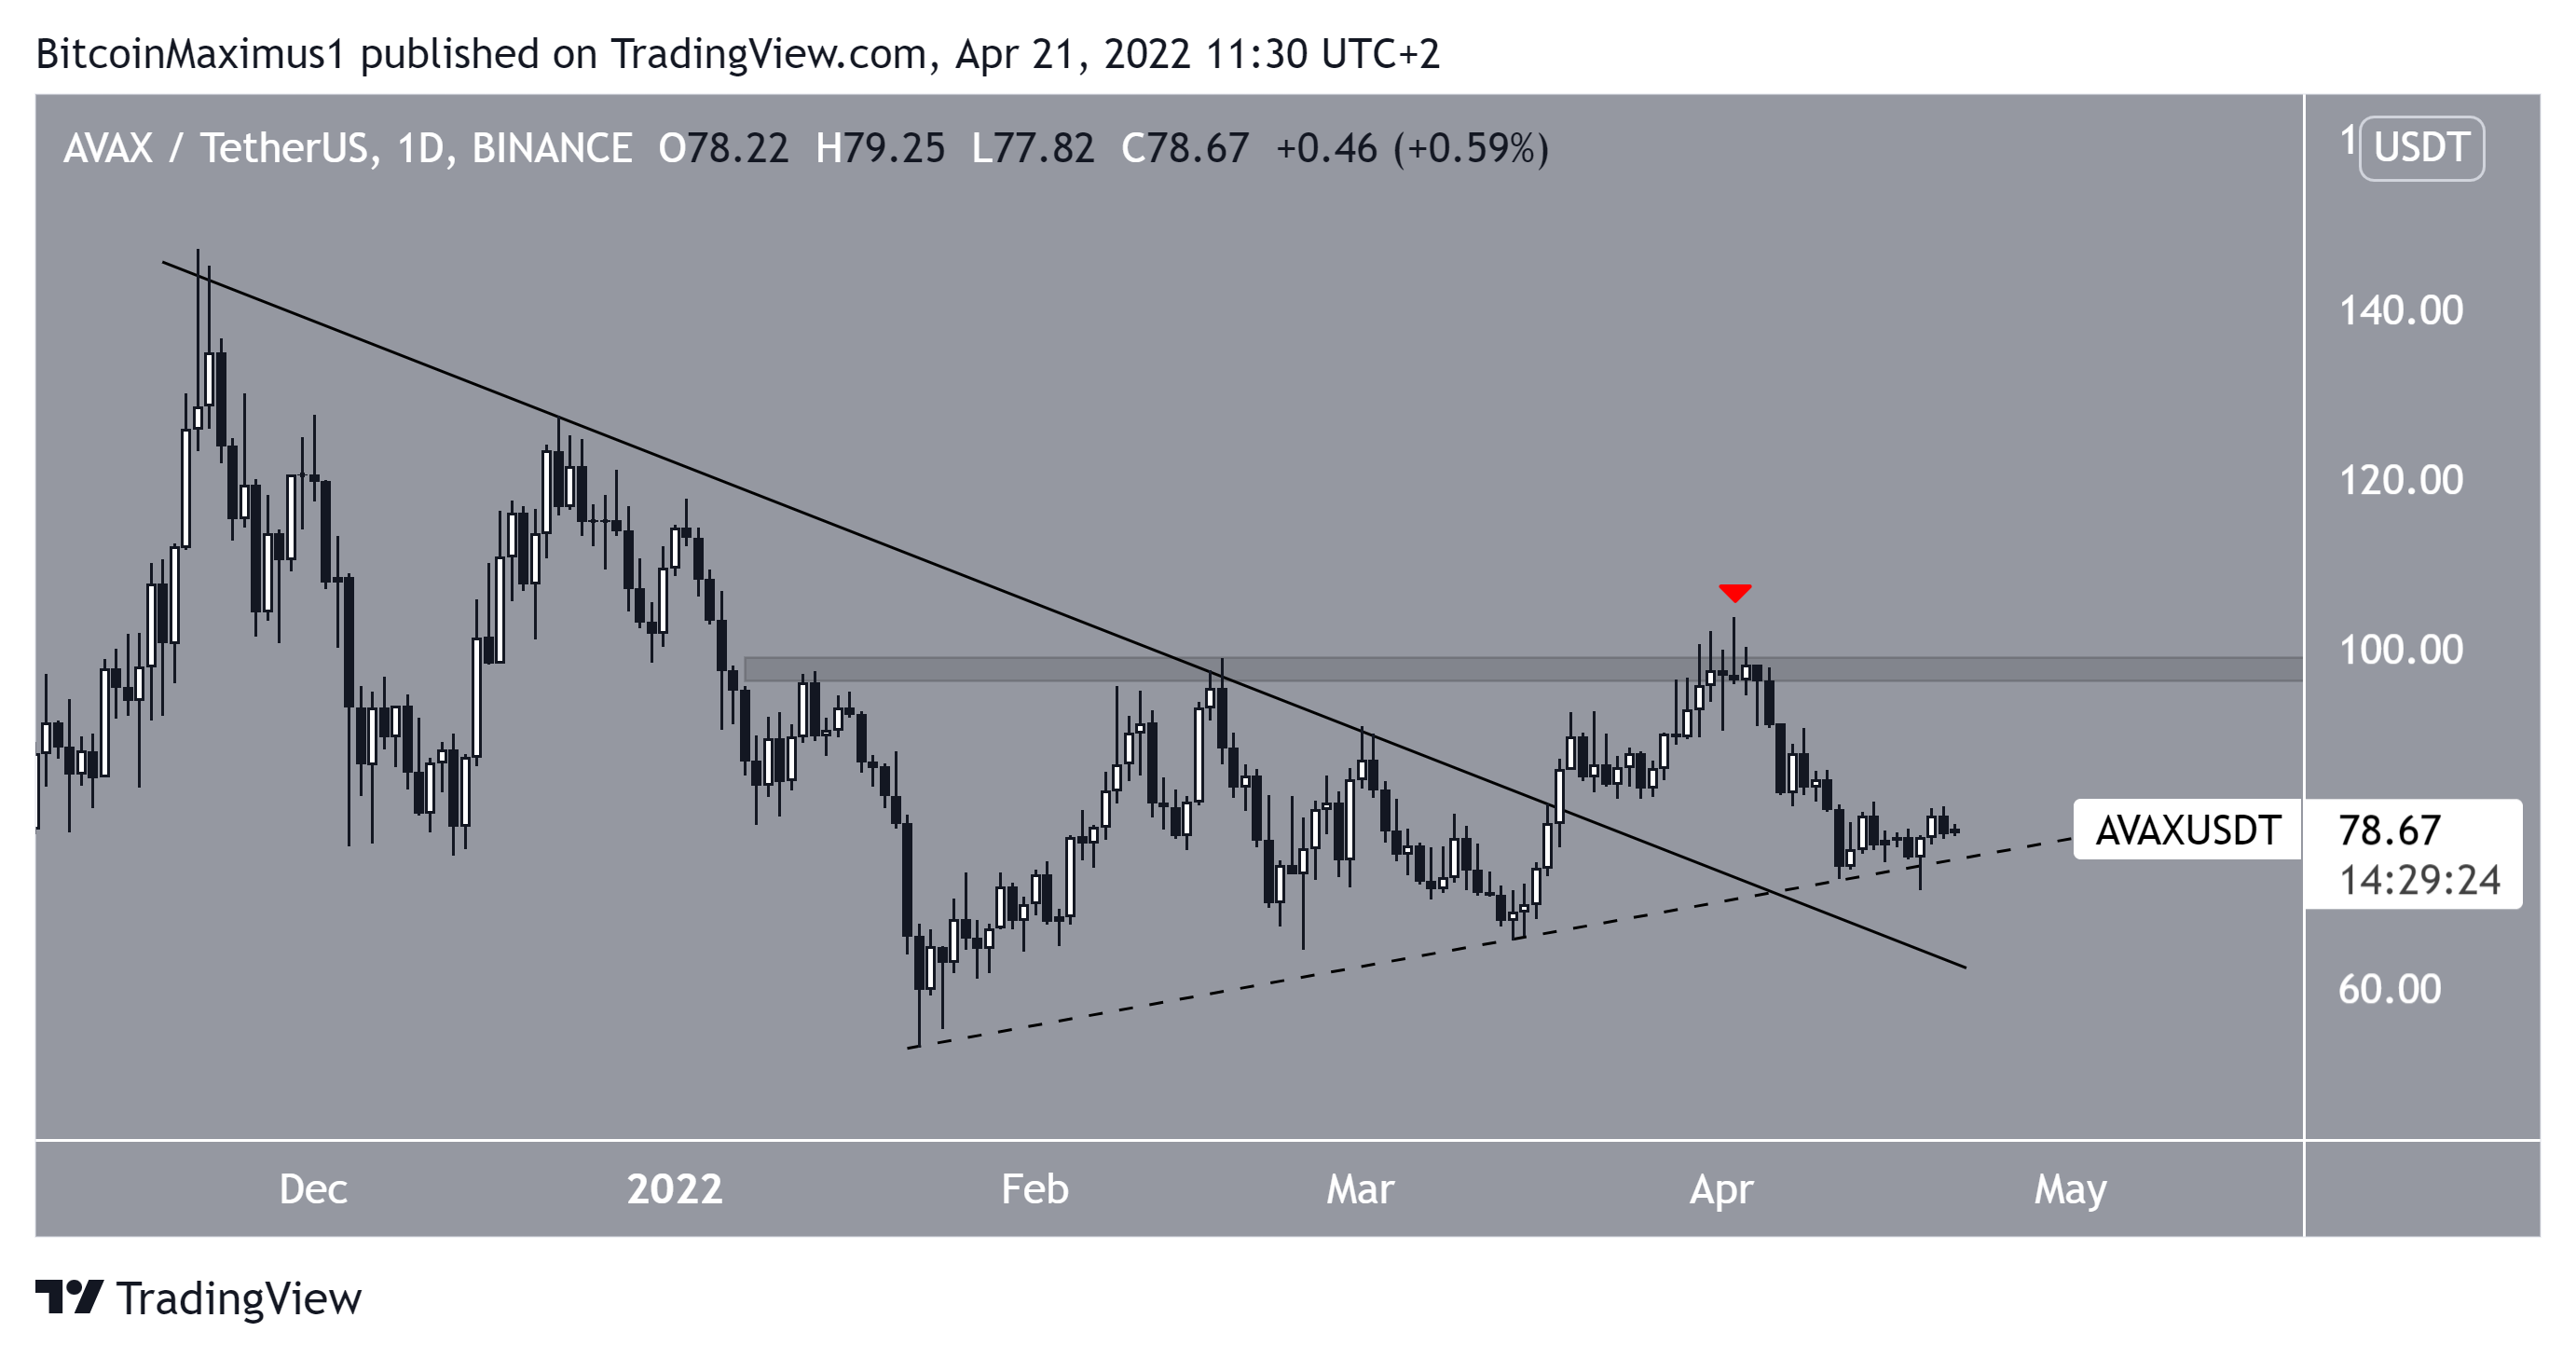
Avalanche (AVAX) had been falling underneath a descending resistance line since reaching an all-time high price of $147 on Nov 21 2021. The downward movement continued until a low of $57 was reached on Jan 22.
Since then the price had been increasing alongside an ascending support line (dashed), and broke out from the previously mentioned descending resistance line on March 28.
As long as the support line is in place, the bullish structure remains intact. The closest resistance area is at $98. The area caused a rejection on April 2 (red icon).
SAND
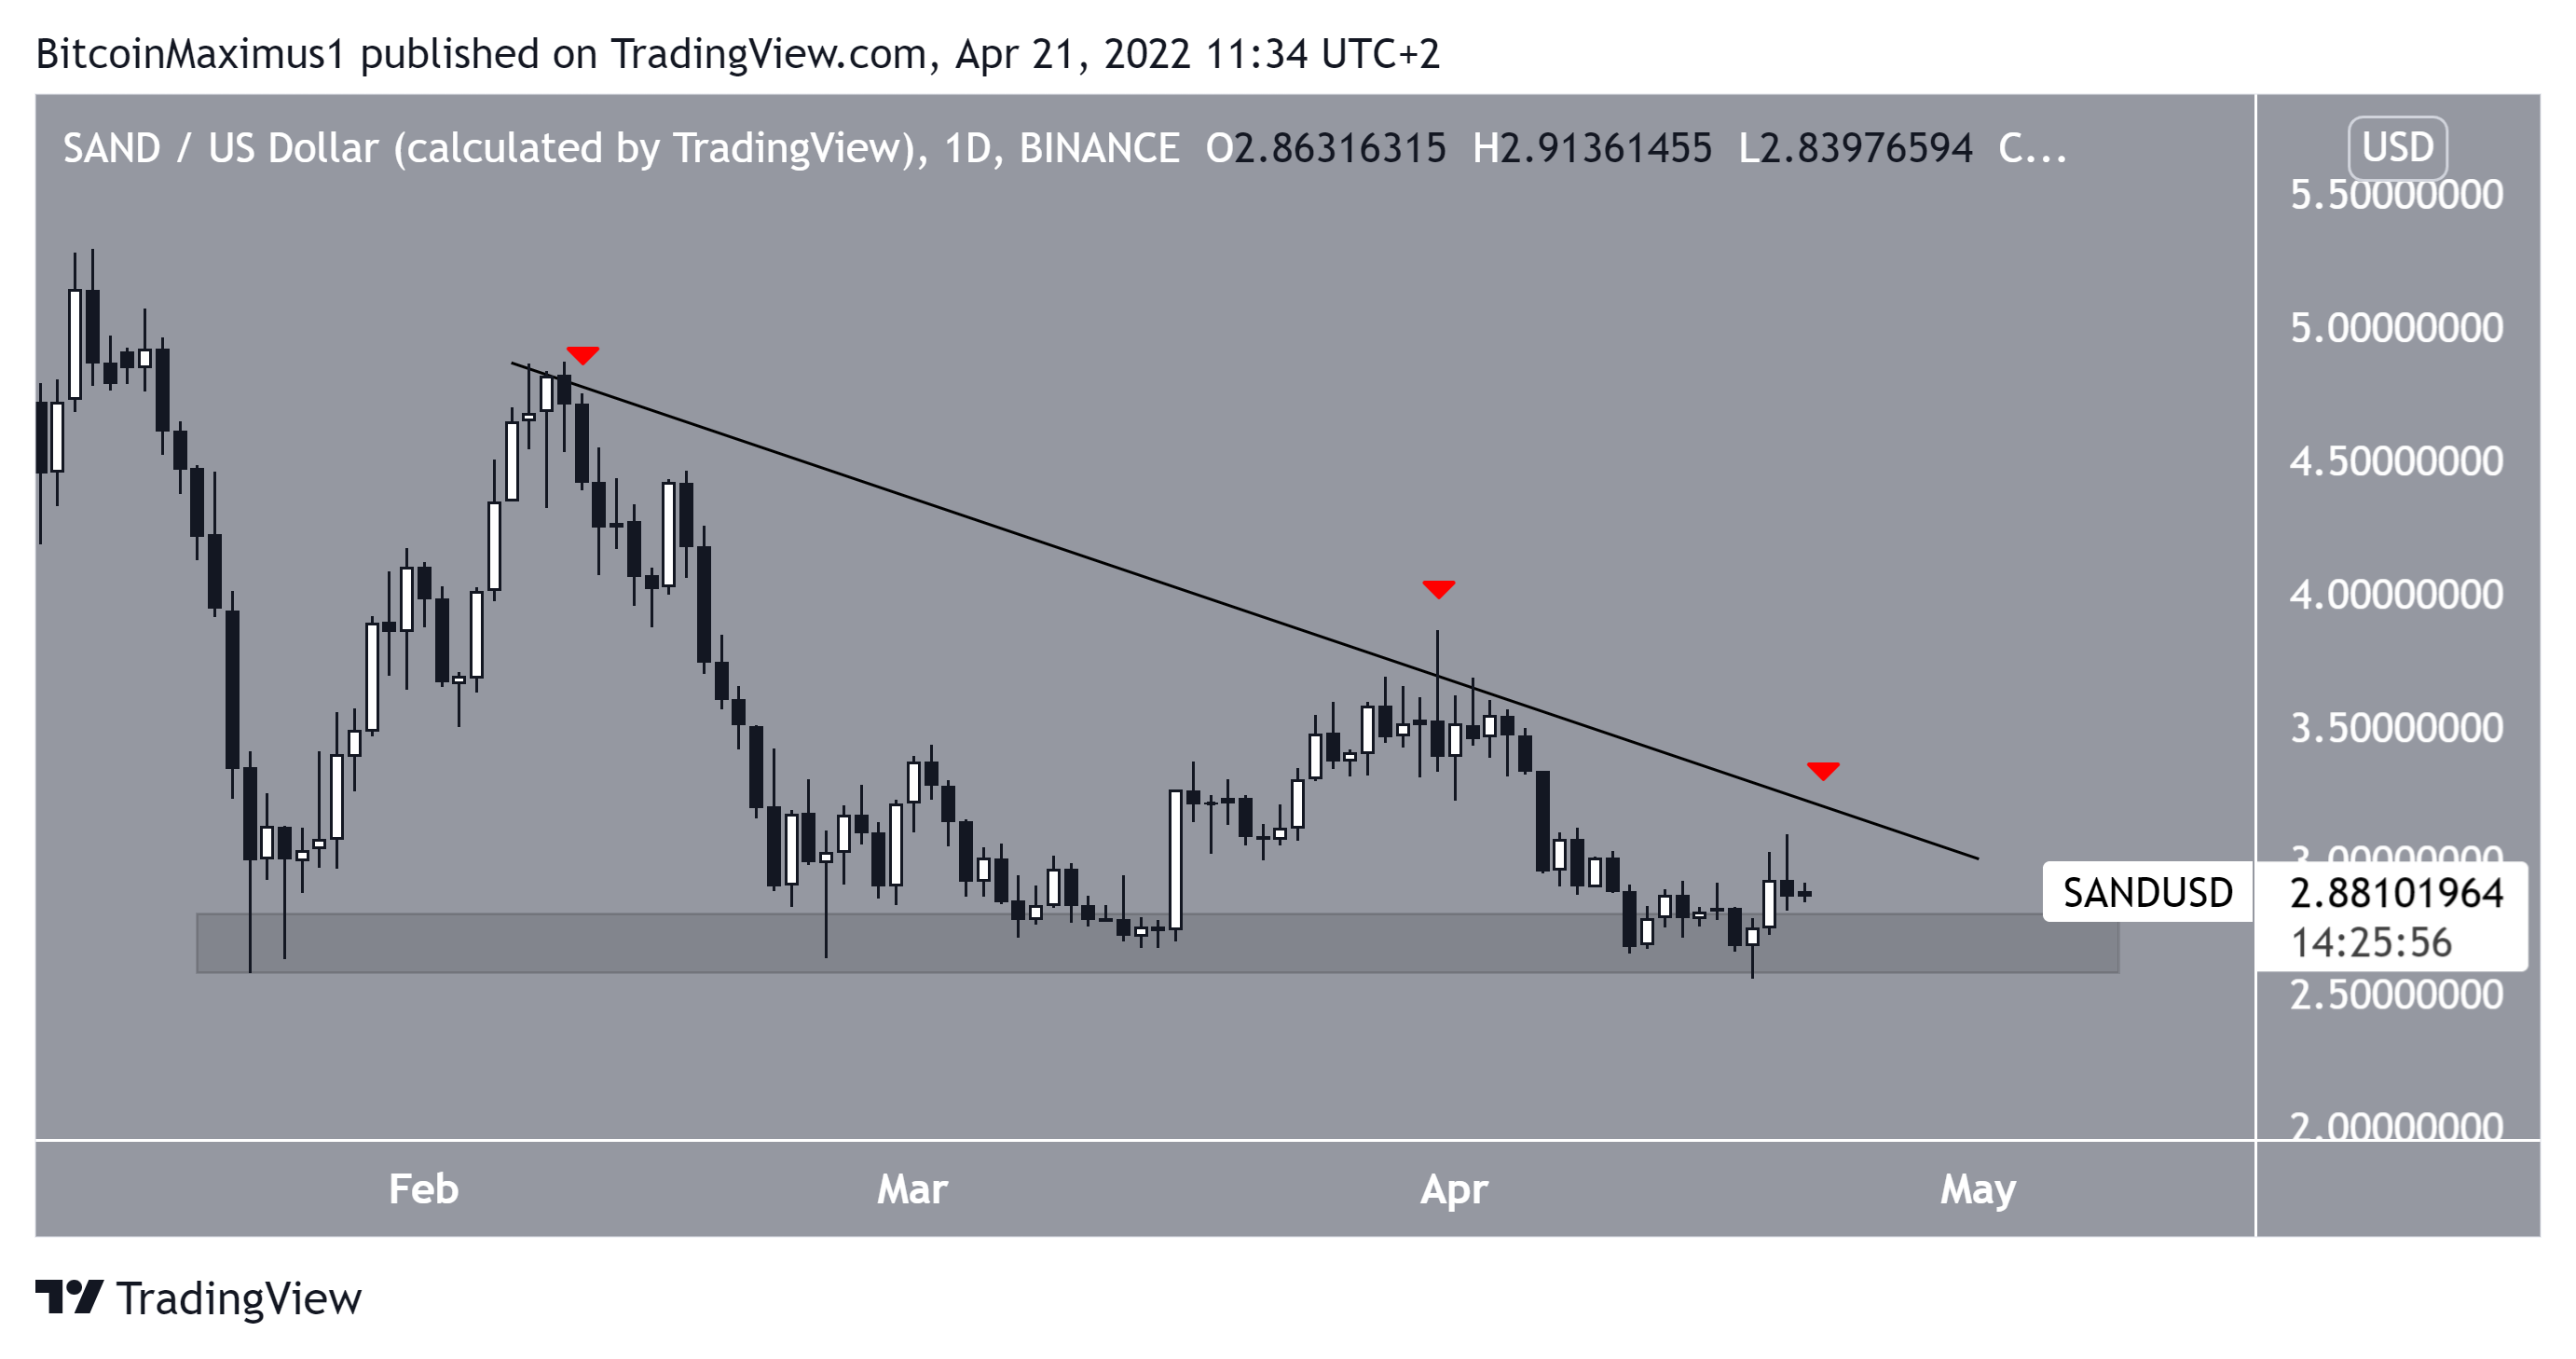
On Jan 22, The Sandbox (SAND) bounced at the $2.70 horizontal support area. It bounced at the same level on March 14 and April 22.
However, each bounce was weaker than the previous one, creating a descending resistance line in the process. When combined with the $2.70 area, this creates a descending triangle, which is considered a bearish pattern.
If SAND were to break down from this triangle, the rate of decrease could accelerate greatly.
HTR
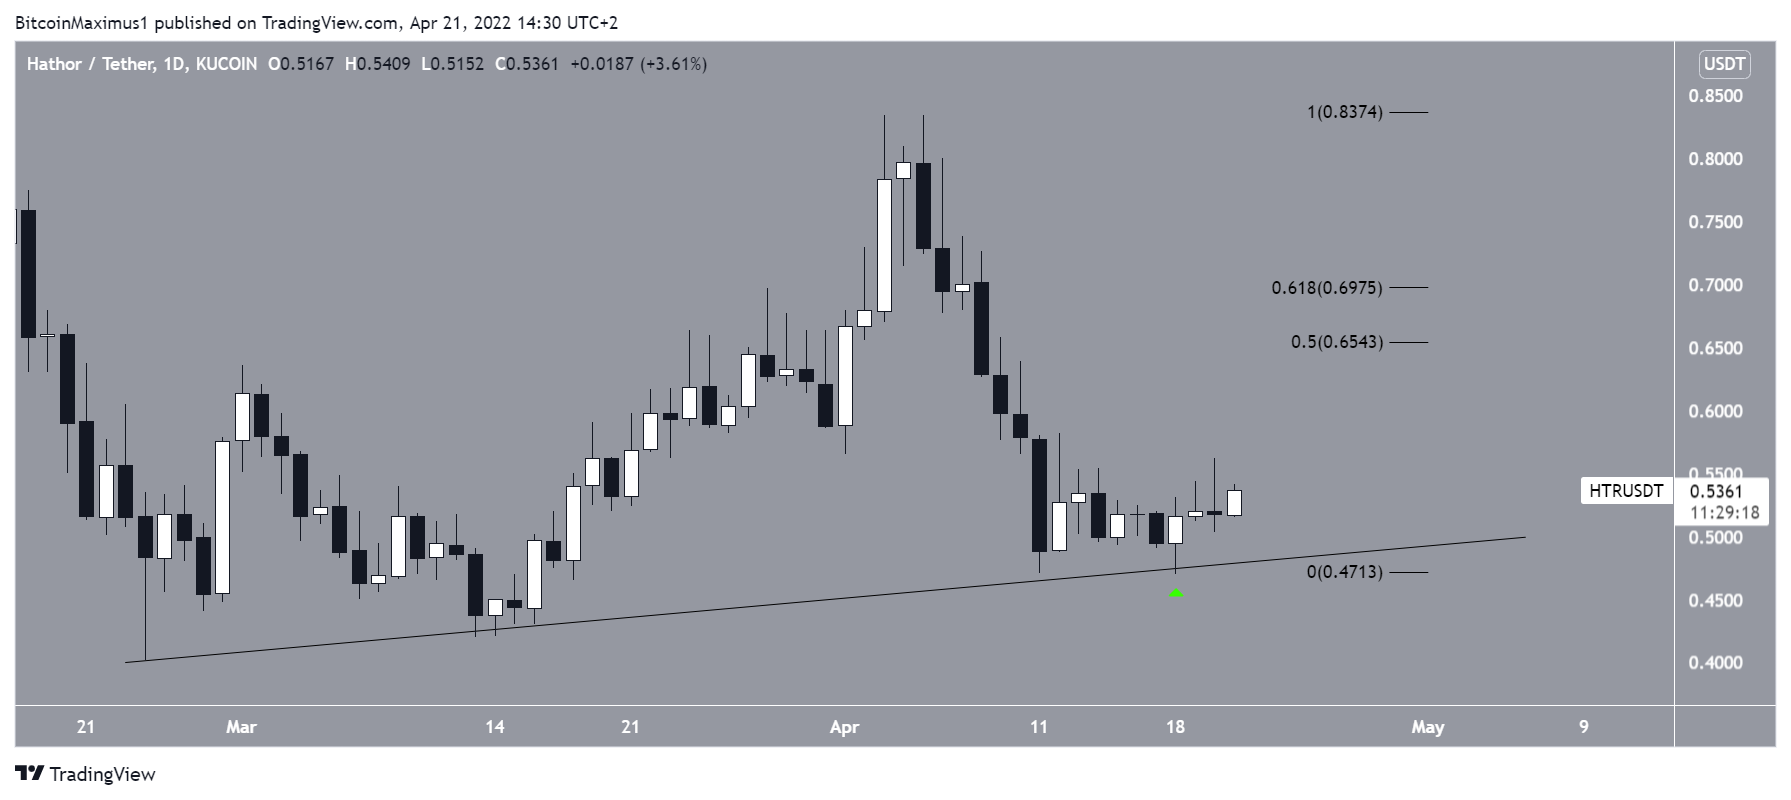
Hathor (HTR) has been increasing alongside an ascending support line since Feb 24. More recently, it bounced at the line on April 18. However, it has yet to initiate a significant upward movement.
If it does, the closest resistance levels would be between $0.65 and $0.69. These are the 0.5 – 0.618 Fib retracement resistance levels.
SHIB
SHIB has been decreasing alongside a descending resistance line since Feb 13. While doing so, it has bounced at the $0.000022 horizontal area thrice, most recently on April 12. This initiated an upward movement towards the descending resistance line.
Whether SHIB breaks down from the $0.000022 area or breaks out from the resistance line will likely determine the direction of the trend.
For Be[in]Crypto’s latest Bitcoin (BTC) analysis, click here
Disclaimer
All the information contained on our website is published in good faith and for general information purposes only. Any action the reader takes upon the information found on our website is strictly at their own risk.

