BeInCrypto takes a look at the seven altcoins that decreased the most over the past week, more specifically from Nov 19 to Nov 26.
These altcoins are:
- Nexo (NEXO) : -20.84%
- ICON (ICX) : -20.05%
- SHIBA INU (SHIB) : -19.02%
- OMG Network (OMG) : -18.94%
- PancakeSwap (CAKE) : -17.80%
- Cardano (ADA) : -17.52%
- Chainlink (LINK) : -15.55%
NEXO
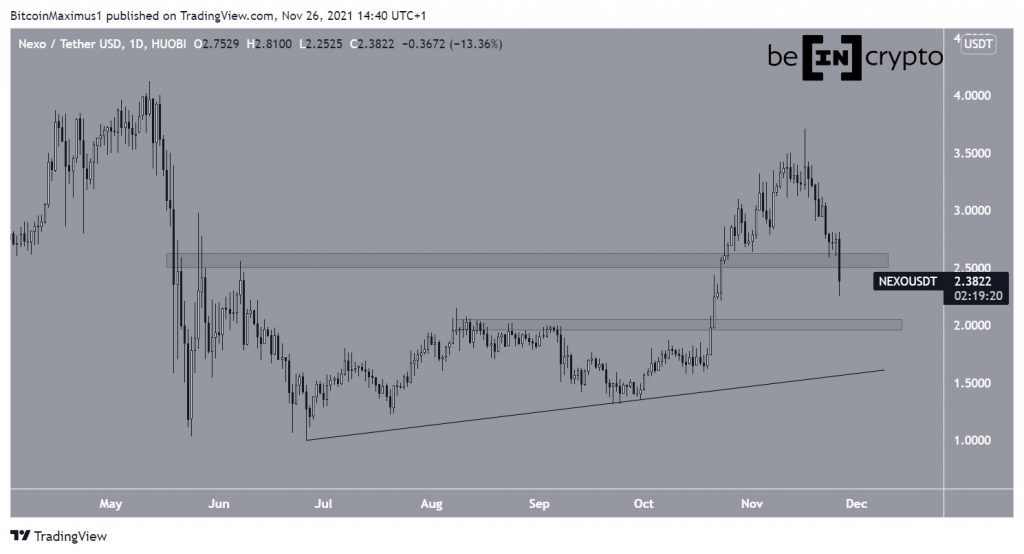
Nexo (NEXO) has been falling since Nov 16, when it reached a high of $3.71. The downward movement took the token below the $2.57 horizontal area, which was expected to act as support. The failure to do so means that the area will likely act as resistance.
The next support area is at $2, while the one below it at $1.6, created by an ascending support line.
ICX
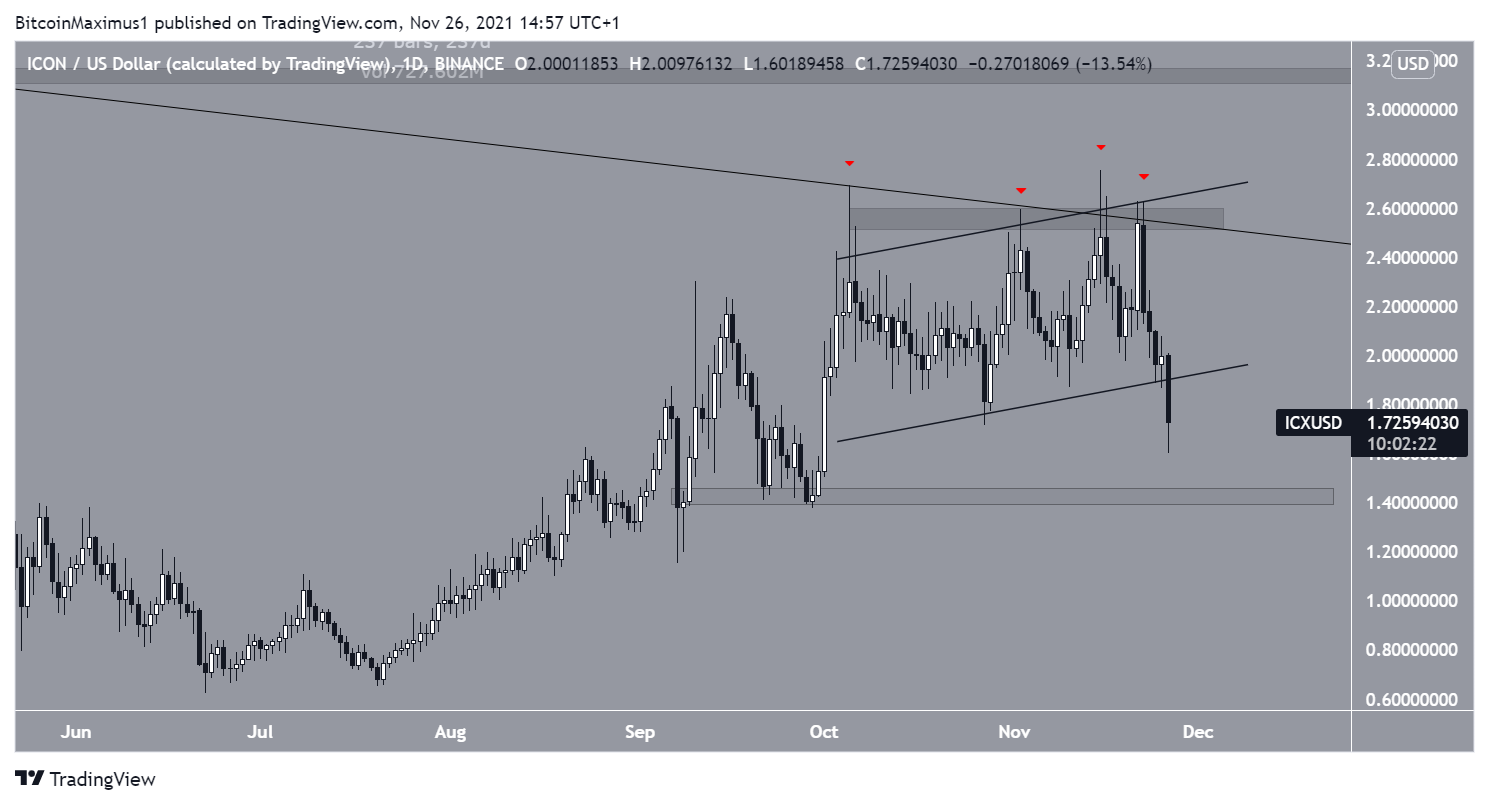
ICON (ICX) has been falling since Nov 22, when it was rejected for the third time by the $2.55 resistance area. The area also coincided with a long-term descending resistance line.
On Nov 26, ICX broke down from an ascending parallel channel and reached a low of $1.60.
The next closest support area is at $1.42.
SHIB
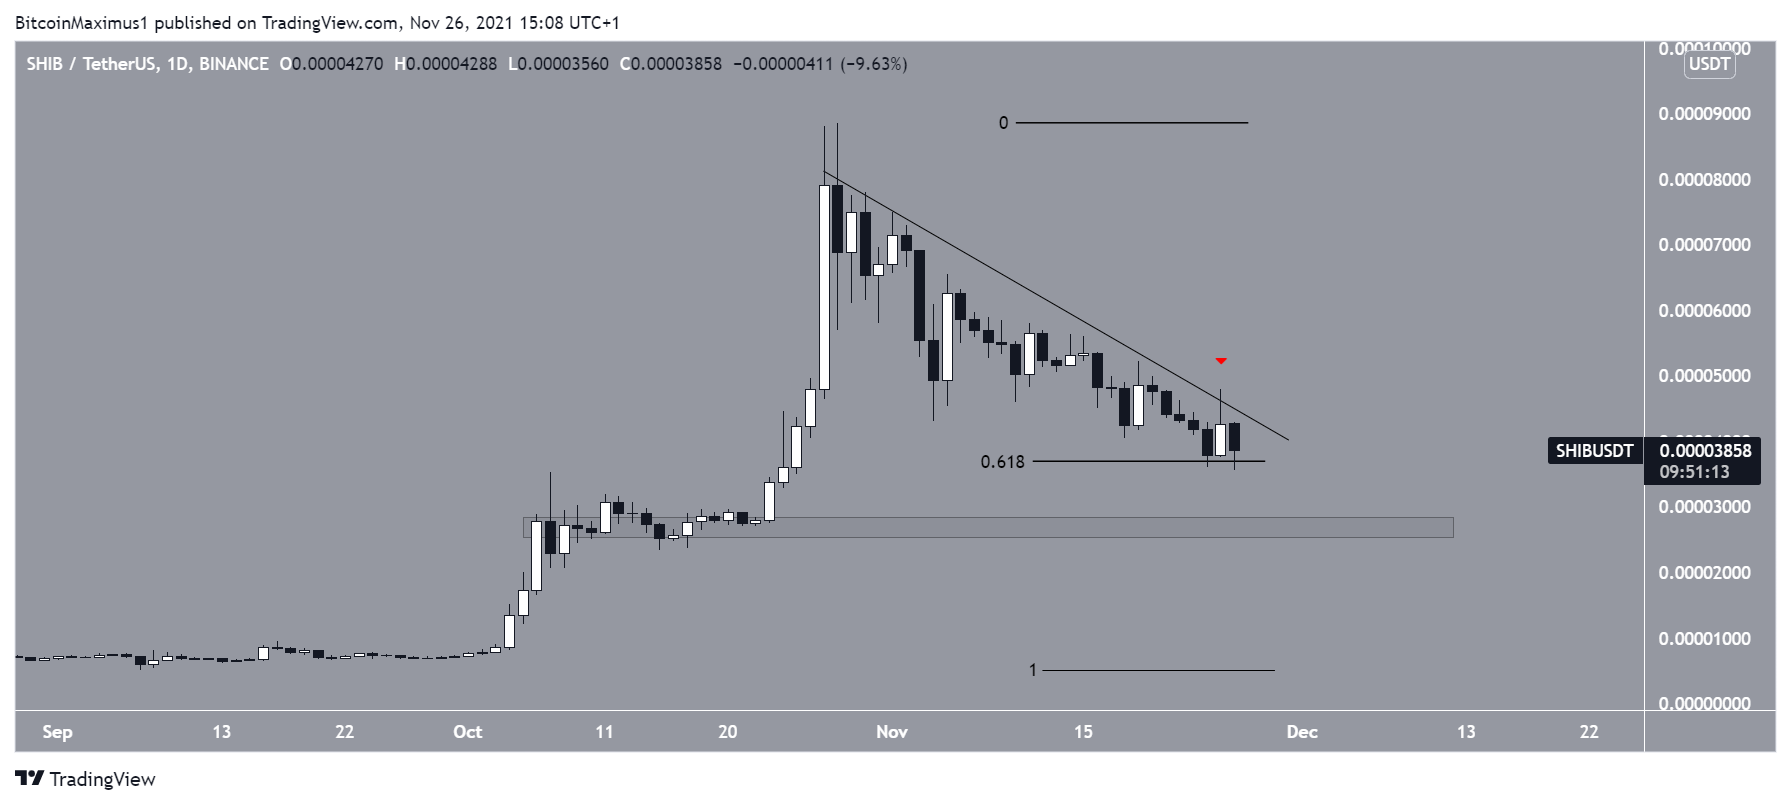
SHIBA INU (SHIB) has been decreasing alongside a descending resistance line since Oct 28. At the time, it had just reached an all-time high price of $0.000088.
On Nov 25, it bounced at the 0.618 Fib retracement support level at $0.000037.
However, it failed to break out from the descending resistance line (red icon). It is now in the process of breaking down from the 0.618 Fib support level.
The next closest support area is at $0.000026.
OMG
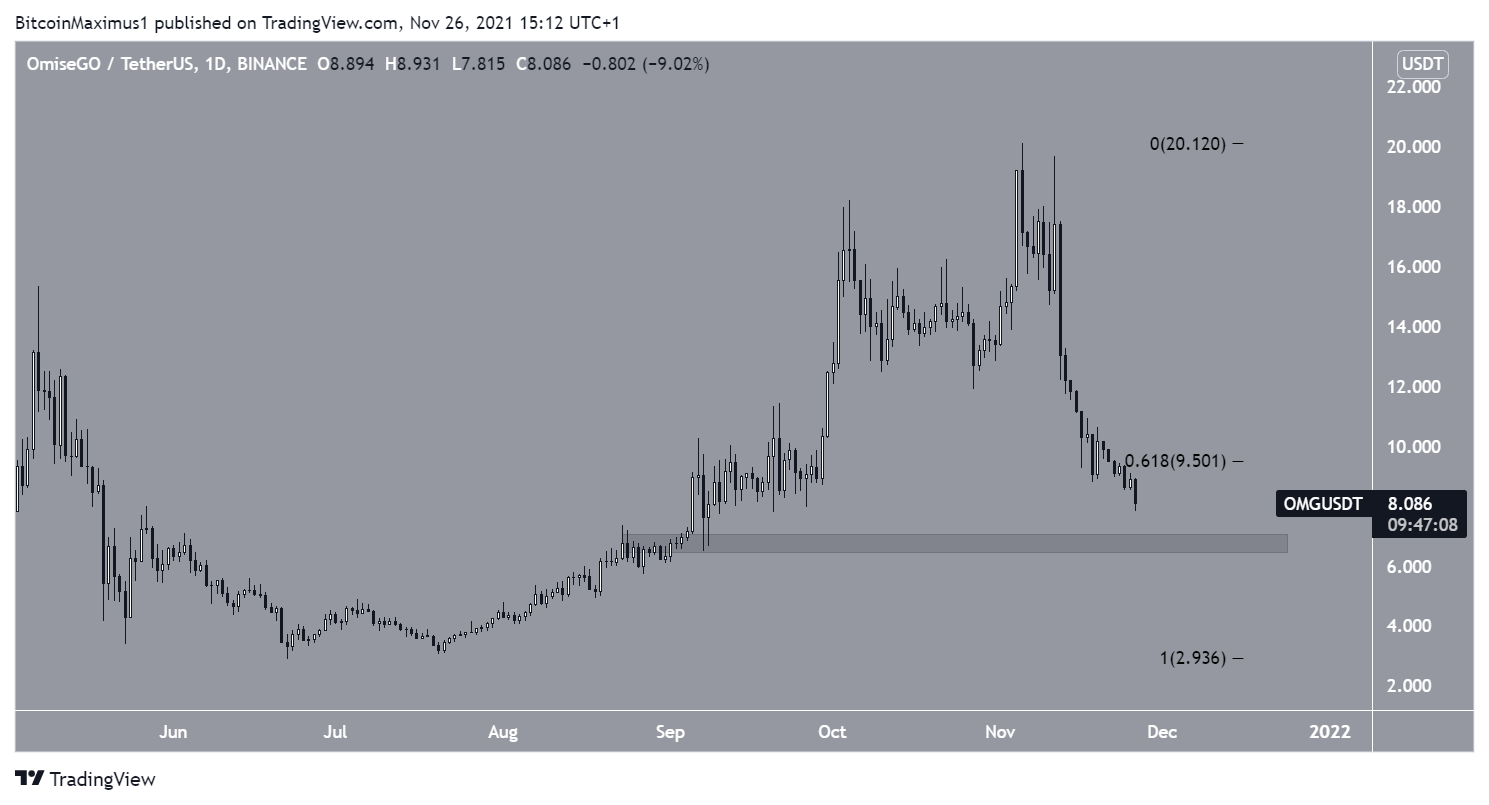
OMG Network (OMG) has been decreasing since Nov 6, when it reached an all-time high price of $20.12. The decrease has been swift, leading to a low of $7.81 on Nov 26. This caused a breakdown below the 0.618 Fib retracement support level at $9.50.
The next support area is at $6.50.
CAKE
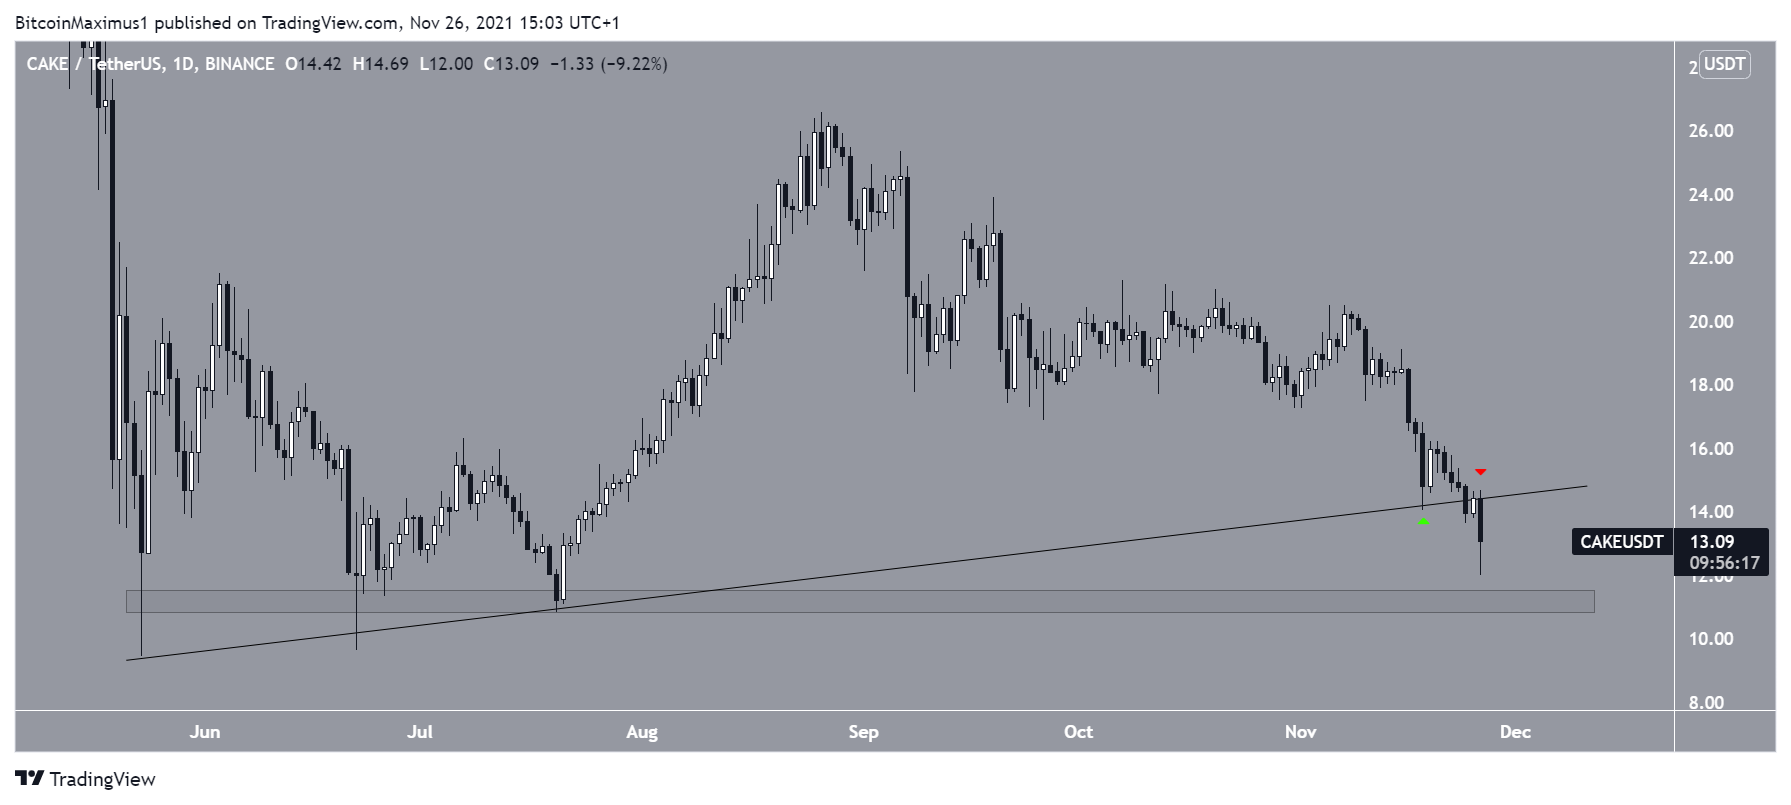
Pancakeswap (CAKE) has been falling since Aug 26, when it had reached a high of $26.60. The decrease took to a low of $14.05 on Nov 18 (green icon).
Initially, CAKE bounced and validated the ascending support line in place since May. However, it broke down on Nov 26 (red icon).
The next closest support area is at $11.
ADA
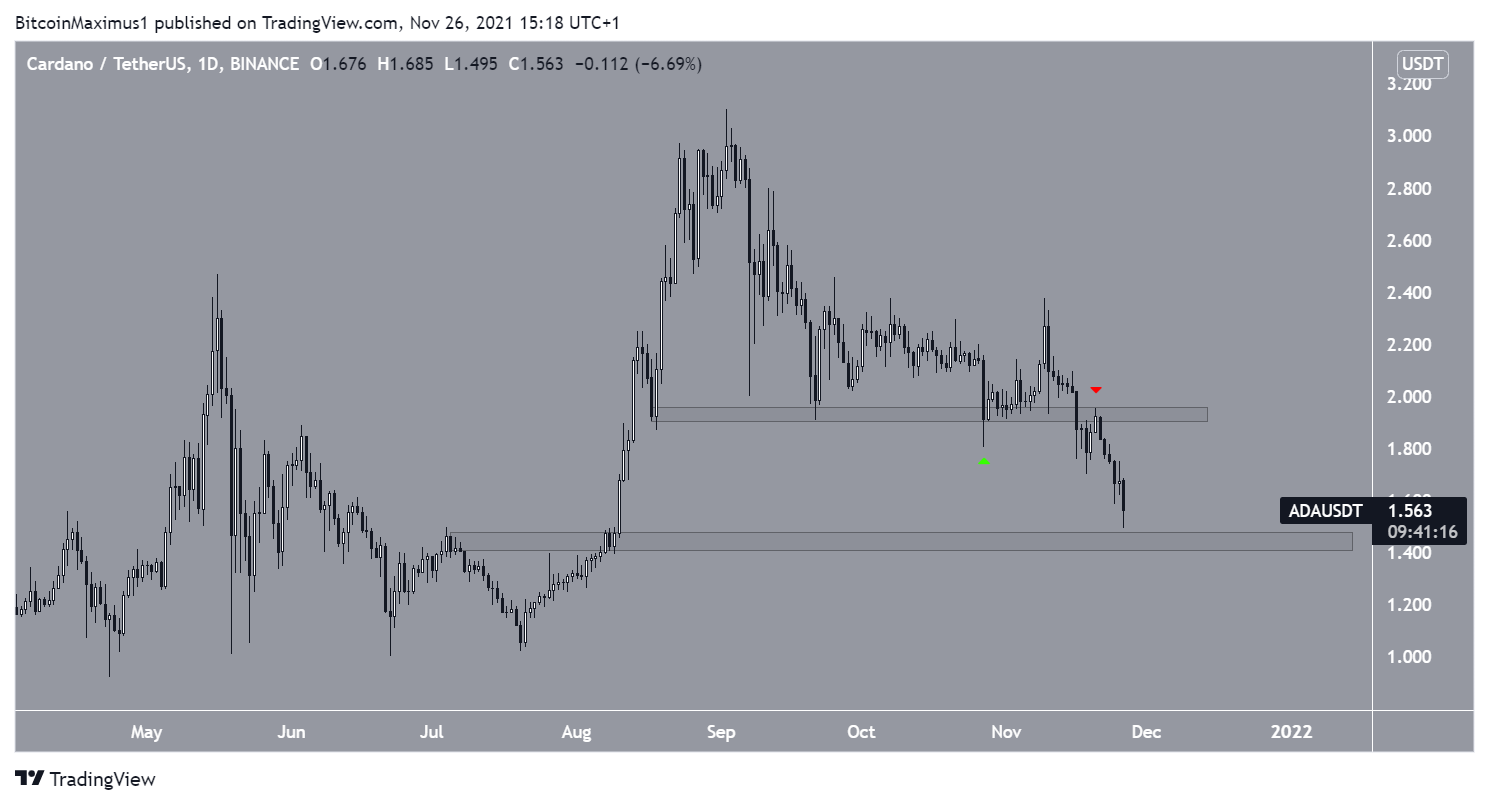
Cardano (ADA) has been falling since Sept 2, when it reached an all-time high price of $3.10. Initially, the token bounced at the $1.95 horizontal support area (green icon), stopping the short-term decrease.
However, ADA broke down on Nov 16 and validated the $1.95 area as resistance (red icon) the next day.
The next closest support area is at $1.45.
LINK
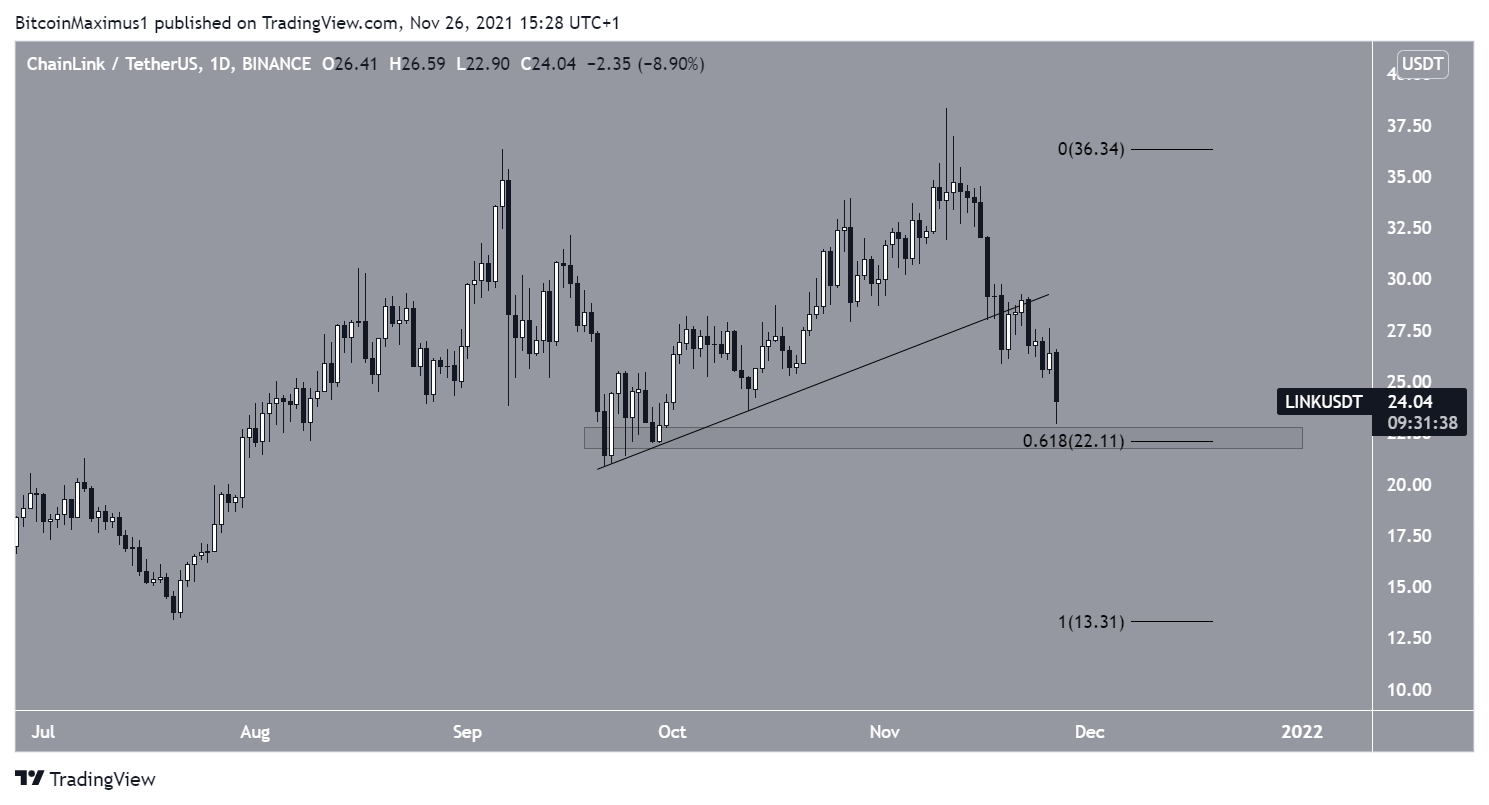
Chainlink (LINK) has been falling since Nov 10, when it reached a high of $38.31. On Nov 18, it broke down from an ascending support line, confirming that the short-term trend is bearish.
LINK is very close to the $22.10 support. This is both a horizontal support area and the 0.618 Fib retracement support level. Therefore, it is likely to initiate a bounce.
For BeInCrypto’s latest Bitcoin (BTC) analysis, click here.
Disclaimer
All the information contained on our website is published in good faith and for general information purposes only. Any action the reader takes upon the information found on our website is strictly at their own risk.

