SHIBA INU (SHIB) has regained its footing after a breakdown from a neutral pattern. However, it has yet to reclaim an important horizontal resistance area.
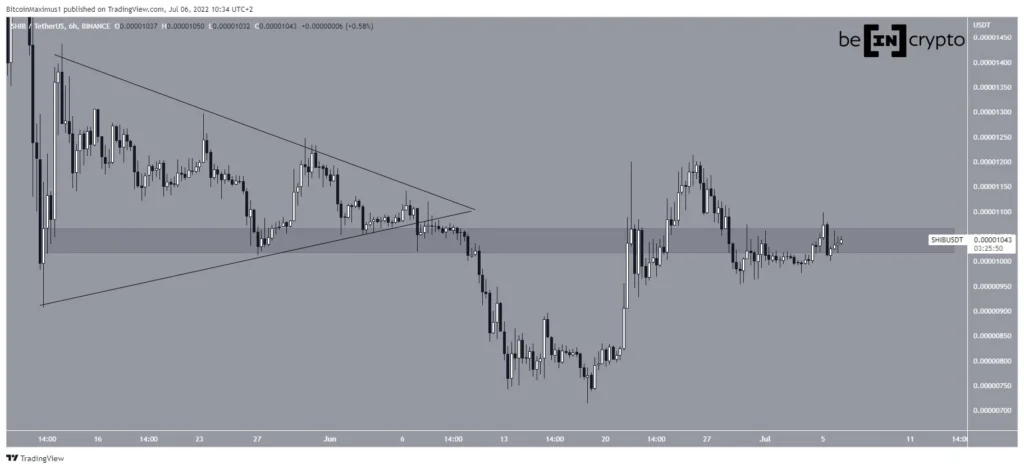
SHIB broke down from a symmetrical triangle on June 6. While the symmetrical triangle is considered a neutral pattern, it is coming after a downward movement.
So, this makes a breakdown more likely. The breakdown also caused a decrease below the $0.0000105 support area.
After the breakdown, the price continued to decrease until it reached a low of $0.0000071 on June 18. The price has been moving upwards since.
While it initially reclaimed the $0.0000105 area, it failed to sustain the upward movement and fell back below it afterwards. Currently, the area is acting as resistance once more.
Future SHIB movement
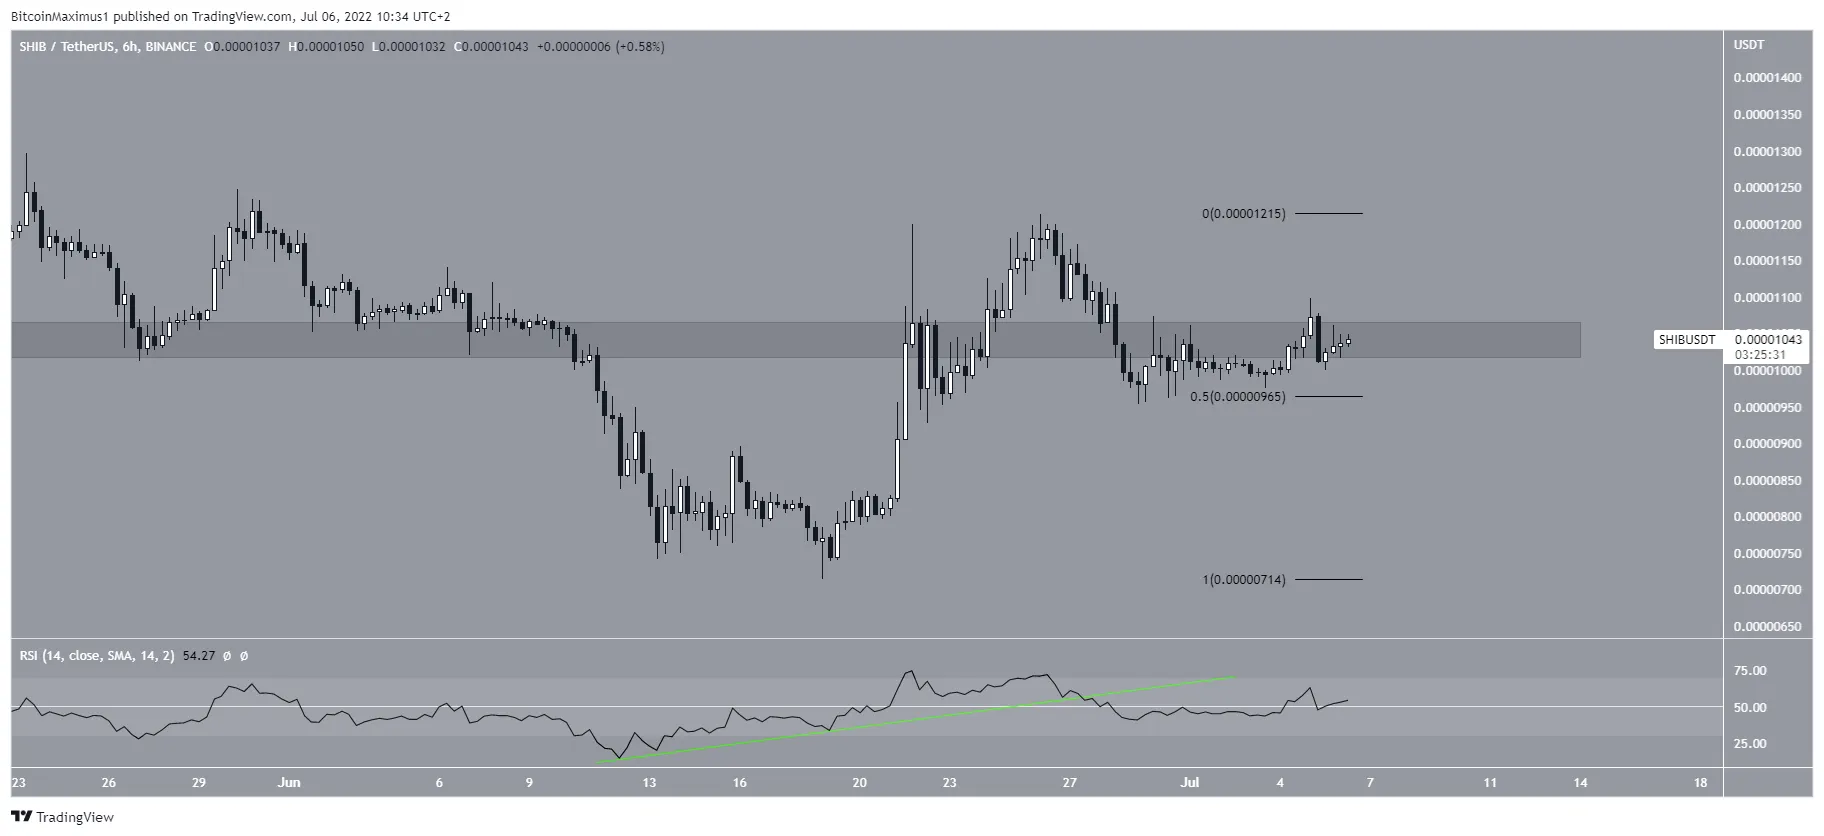
A closer look at the movement shows that a significant bullish divergence in the RSI preceded the entire increase. Now, the trend line of the divergence has broken. The RSI is currently right at the 50 line, which is considered a neutral reading.
Additionally, the price is trading above the 0.5 Fib retracement support level but below the $0.0000105 resistance area. So, the reading from the six-hour time frame is entirely neutral.

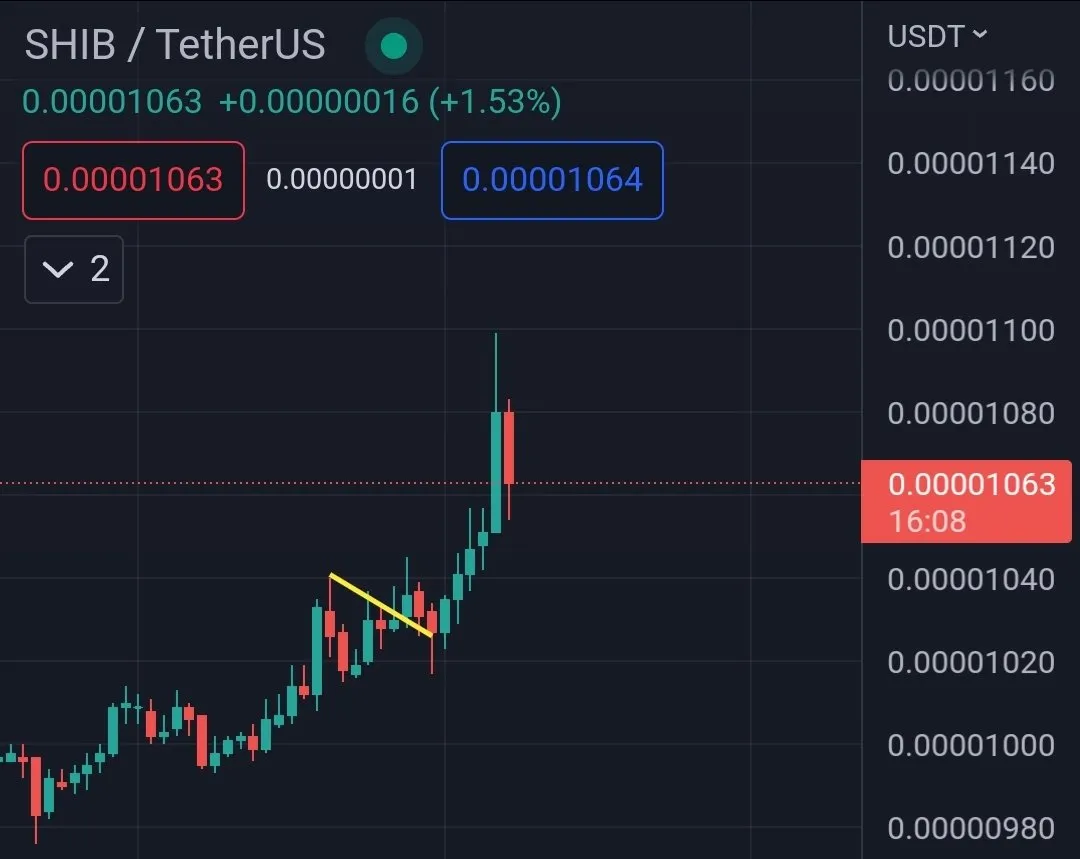
SHIB enthusiast @army_shiba tweeted a SHIB chart which shows that the price has increased to a high of $0.00001.

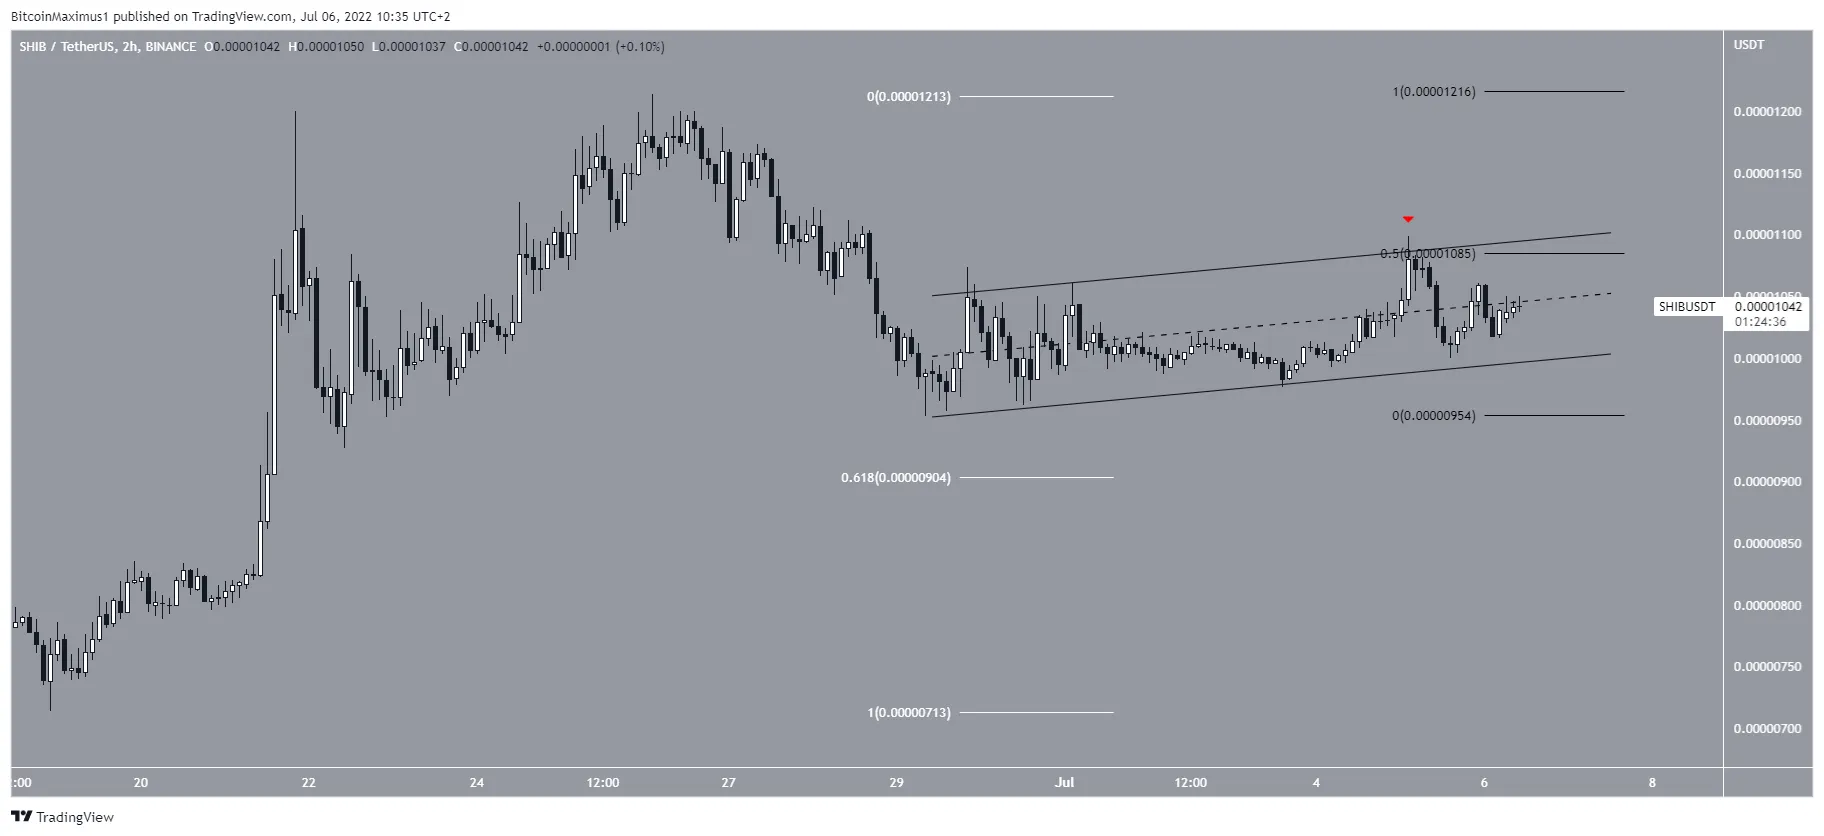
Since the tweet, the price has been rejected and fallen slightly. The rejection served to validate the 0.5 Fib retracement resistance level and the resistance line of an ascending parallel channel (red icon).
Since such channels usually contain corrective movements, an eventual breakdown from it would be expected. This possibility is further strengthened by the fact that the price is trading inside resistance.
If a breakdown occurs, the price could decrease towards the 0.618 Fib retracement support level at $0.000009 (white).

For Be[in]Crypto’s latest bitcoin (BTC) analysis, click here
Disclaimer
All the information contained on our website is published in good faith and for general information purposes only. Any action the reader takes upon the information found on our website is strictly at their own risk.


