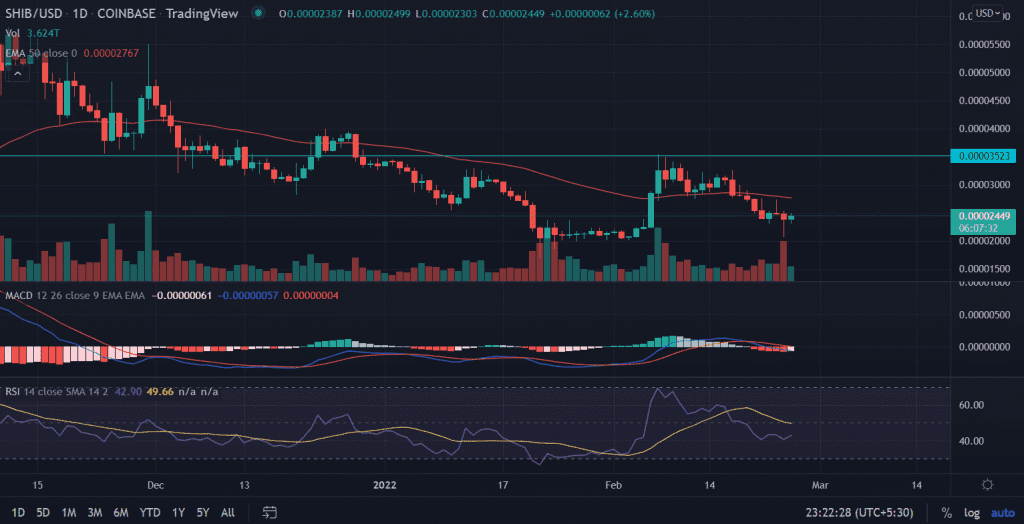
SHIBA Inu (SHIB) price trades higher on Friday after falling more than 7% in the previous session. SHIB smashed down to a crucial support level after news of Russia attacking Ukraine spread. Today’s price action reveals the possibility of a move to $0.000035 as it recovered from the lows of $0.000020.
- SHIBA Inu (SHIB) jumps nearly 3% on Friday.
- Bulls mulling over a possible push above the 50-day EMA in pursuit of a 45% upside rally.
- Uncertainty and Volatility are set to rule the price action in short term.
As of press time, SHIB/USD is trading at $0.000020, up 2.76% for the day. The 14th largest cryptocurrency by market cap held a 24-hour trading volume of $2,217,179,252 with more than the loss of 21%.
SHIB trades near crucial level
On the daily chart, SHIBA Inu (SHIB) consolidates in late January after testing lows of $0.000017 rallied nearly 105%
SHIB bulls face multiple rejections near the significant $0.000035 as investors flipped the support-turned-resistance level. But SHIB buyers lack the conviction to continue with the uptrend. As price enters a retracement of 42%.
In the previous session, SHIB broke the crucial $0.000025 support level because of intense selling pressure. However, as the dust settles down the asset bounce back to the mentioned level with a renewed buying sentiment.
The formation of a ‘hammer’ candlestick signaled that bears have tired now and looking for an upside reversal.
Going forward, SHIB could face an upside hurdle at the 50-day EMA (Exponential Moving Average) EMA at $0.000027. A decisive close above this level makes the journey easy for bulls to capture the horizontal resistance line at $0.000035.
Now, if the price slips below the session’s low then it would negate the bullish theory with the interim support at $0.000020.
Technical Indicators:
RSI: The Daily Relative Strenght Index (RSI) holds near 40 below the average line still pointing at the weakness.
MACD: The Moving Average Convergence (MACD) hovers below the midline with a neutral bias.


