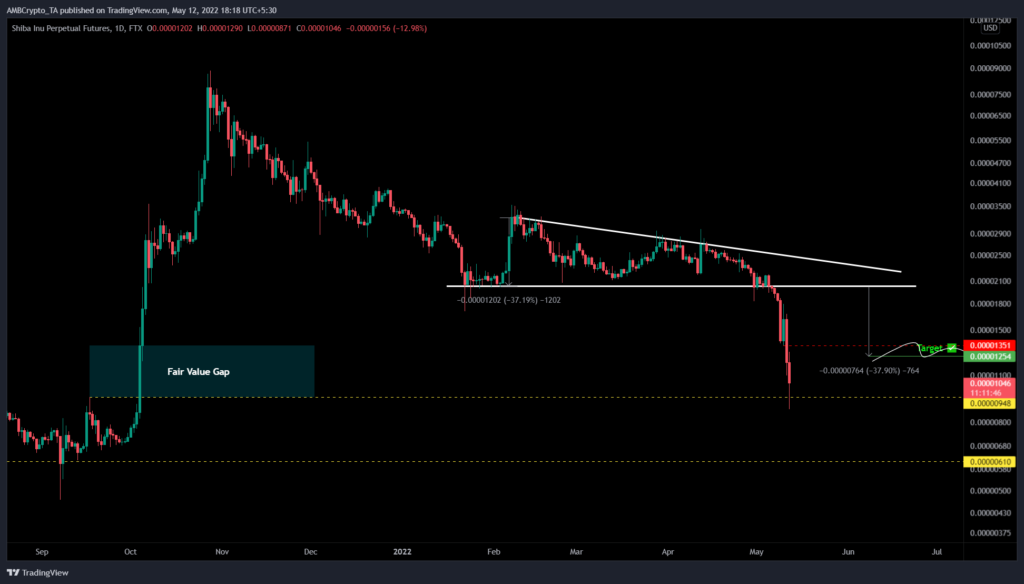
Shiba Inu price has dropped down to levels that were last seen in late September 2021 before the altcoin began its well-known exponential run-up to new highs. This massive crash comes at a time when the entire market is plagued with fear and where investors are panic selling their holdings in a frenzy.
Shiba Inu price and its significant levels
Shiba Inu price consolidation between 2 February and 5 May formed a descending triangle. This technical setup contains lower highs and equal lows. Drawing trend lines connecting these trend lines reveals a descending triangle.
The target for this pattern is obtained by measuring the distance between the highest peak or the first swing high and the base of the triangle and adding to the breakout point. For Shiba Inu this measure is 37% and adding this value to the breakout point reveals a target of $0.0000125.
Due to the panic selling frenzy in the crypto markets, Shiba Inu price has crashed 57% in the last six days, going way below its target. This move also filled the fair value gap extending from $0.0000094 to $0.0000135 and is currently bouncing off the $0.000094 support level.
As Bitcoin price looks to trigger a relief rally, investors can expect Shiba Inu price to also see an uptick in buying pressure, especially from market participants looking to accumulate SHIB at a discount. This development is likely to push SHIB up by 31% from its current position to tag the immediate resistance barrier at $0.0000135.
Considering the bearish outlook of the crypto ecosystem, it is unlikely Shiba Inu price will continue heading higher. Therefore, interested investors could open a short position here. A rejection off this hurdle could trigger another crash in SHIB and push it down to $0.0000094.
If the sellers breach this barrier, Shiba Inu price could nosedive to $0.0000061. This move would constitute a 55% descent from $0.0000135 and is likely where the bottom is.
Supporting this move for Shiba Inu price is the 30-day Market Value to Realized Value (MVRV) model. This indicator is used track the average profit/loss of investors that purchased SHIB tokens over the past month.
Light at the end of the tunnel
Generally, a negative value indicates that these holders are underwater and a positive value indicates that holders are in profit. The probability of a sell-off is high in the latter condition.
Based on Santiment’s backtests, a value between -10% to -15% indicates that short-term holders are at a loss and long-term holders tend to accumulate under these conditions. Therefore, the aforementioned range is termed an “opportunity zone,” since the risk of a sell-off is less.
Currently, the 30-day MVRV is hovering around -46%, which is a perfect accumulation zone. The last time the index fell to these levels, SHIB was in an accumulation zone, which eventually led to a breakout.
However, this time around, the market structure is weak and can be interpreted as a short-term buy signal.


