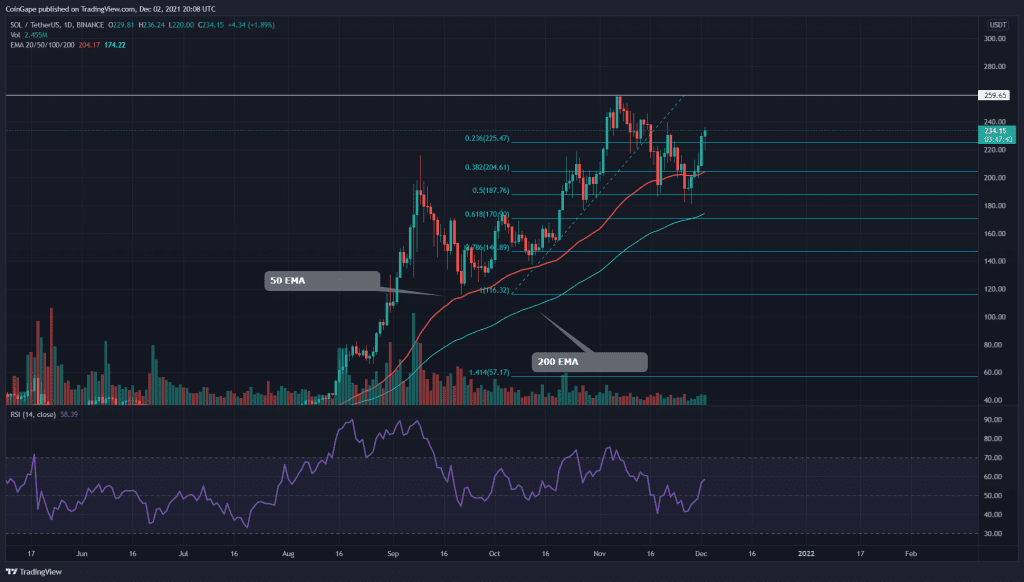
The technical chart of SOL/USD shows a steady uptrend for this coin. The price currently shows an impressive recovery from its recent correction phase as it strongly charges towards the All-High resistance of $260. The price is currently trading at the $234.5 mark, with an intraday gain of 2.15%.
Key technical points:
- The SOL price bounced from 0.5 Fibonacci retracement level
- The intraday trading volume in the SOL coin is $4 Billion, indicating a 28% hike.
Source- SOL/USD chart by Tradingview
As mentioned in my previous article on SOL/USD, the coin’s correction phase reached the 0.5 FIB level. The coin price managed to obtain sufficient support from this rally, and on November 28th, the price bounced back with a morning star pattern.
The SOL coin showed an impressive recovery in this chart with five consecutive green candles. By the press time, the coin is 23% up from the new lower low of $187 and is steady charging to the overhead resistance of $260.
The crucial EMA levels(20, 50, 100, and 200) project the coin’s bullish trend. Moreover, the Relative Strength Index(58) indicates a bullish sentiment among the market participants.
SOL/USD 4-hour Time Frame Chart

Source- SOL/USD chart by Tradingview
This lower time frame chart indicates the SOL price has recently breached a confluence of resistance level from the $220 mark and a resistance trendline. The coin price validated this breakout with the successful retest phase and now offers a good follow up for the rally.
However, the crypto traders can wait for the price to reclaim the All-time high resistance of $ 260, which will confirm if the price is ready to resume this uptrend.
According to the traditional pivot level, the crypto trader can expect the next resistance level at $256, then $280. And on the flip side, the support levels are $205 and $184.


