SOL price trades on a muted note with modest gains. The price glides into a tight range with limited price action. However, the formation of the ‘Doji’ candlestick indicates indecision among investors. As the altcoin hovers in a narrow phase, the next candlestick would set the directional bias.
- SOL price retreats below $50.0 as the selling pressure remains intact.
- On the 4-hour chart, the price approaches the 20-day EMA predicting more gains above this level.
- A weekly candlestick below $36.0 would invalidate the bullish outlook on the asset.
SOL price trades sideways
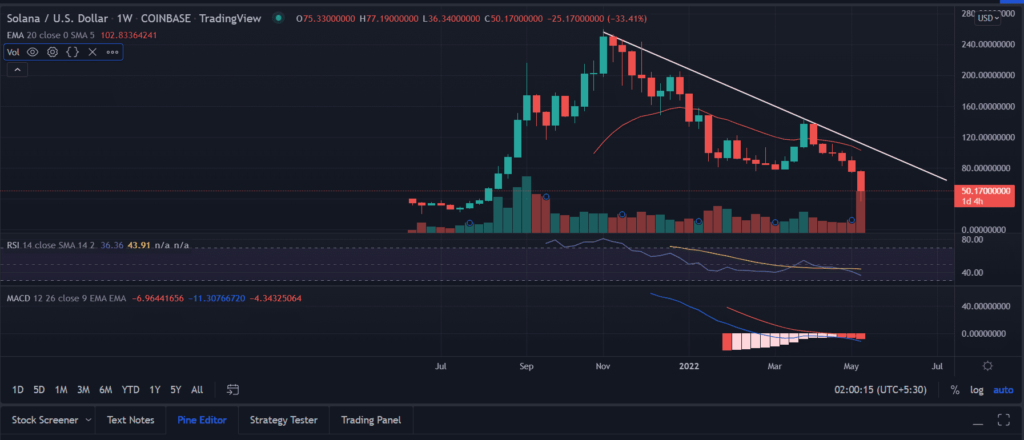
SOL price is still struggling to recover post a broader market sell-off. There seems to be no end to this massive downside trend. On moving down, the SOL price tested the lows of $35.0 for the first time in 10-month.
The descending trend line from the record highs acted as a strong resistance barrier for the bulls. The price tested the bearish line thrice but was unable to get through making lower lows. A slippage below the 20-day EMA (Exponential Moving Average) at $118.07 on March 28. Since then, the price dropped by 69%.
Source: Trading view

Currently, the price hovers near the crucial $50.0 mark, a sustained buying pressure would push the price higher to test $60.0. The next upside filter stands at 100-day EMA (Exponential Moving Average) at 74.
Trending Stories
On the flip side, a weekly candlestick below $36.34 would invalidate any bullish outlook on the asset. In that case, the price could drop to the levels last seen in August 2021, at $32.36.
As of press time, SOL/USD trades at $50.24, up 2.66% for the day.


