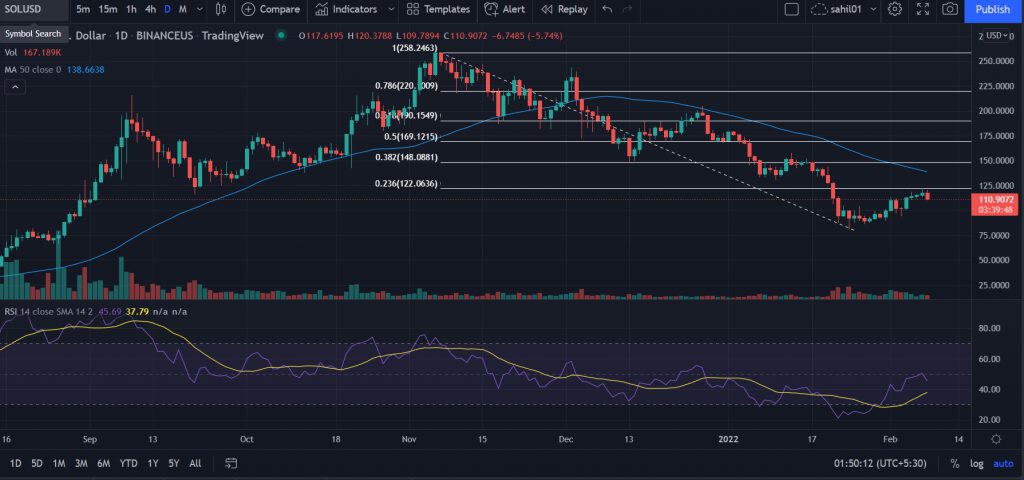
Solana’s (SOL) price has traded in red on Tuesday after four days of gains. The price remained pressure toward the support-turned-resistance level placed near the $122.0 level.
- Solana (SOL) Price runs out of fuel near $122.0.
- The prices pause after taking up a 51% upside run from January’s low.
- Sellers could push Solana down by nearly 30% if resistance holds.
As of press time SOL/USD is trading at $110.61, down nearly 6% with a 24-hour trading volume of $2,629,824,608.
SOL price faces downside risk
On the daily chart, the Solana (SOL) price has retreated from the all-time highs made on November 6 at $260.0. January has been a volatile month for the cryptocurrency market, SOL tested lows of $80.79 on January 24.
Since then SOL has picked up the momentum and scored a 51% upside. However, investors lose the strength near the $122.0 level, which also coincides with 0.236% Fibonacci retracement.
The Daily Relative Strength Index (RSI) has turned toward 42 from the recent highs. The recent downtick signifies the downside pressure in the pair remains intact.
The selling pressure has been intensified after SOL descend below the 50-DMA at $202.22. Furthermore, the formation of a ‘Doji’ candlestick just below the moving average fuels the downside momentum.
Now, if the price sustains below the session’s low then it could test the low of January 31 at $89.26. Next, market participants would explore the lows made in August around $72.0.
On the flip side, a decisive close above the 0.236$ Fibonacci retracement level would target the $150.0 horizontal resistance level. It would also mark the breaching of the crucial 50 DMA.
Next, investors could challenge the 0.50% Fibonacci retracement level at $175.0. Buyers would be convened for a trend reversal beyond the December 27 high of $204.82.


