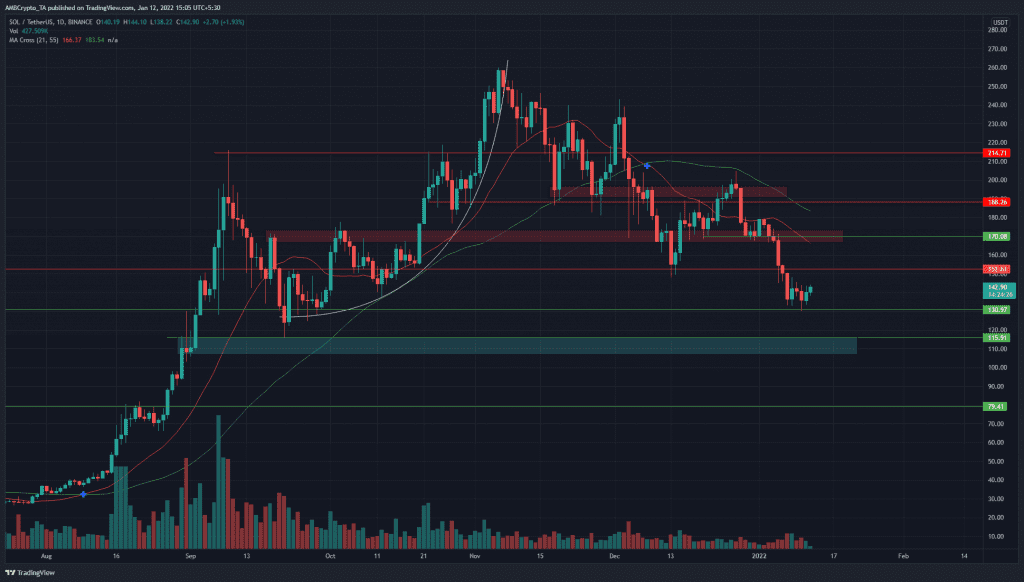
Solana faced some problems such as slow transactions and network congestions in recent weeks. Against this backdrop, the price has been steadily declining, with the latest sell-off from $170 forced by Bitcoin’s drop below $45.8k. It appeared likely that continuation of the downtrend was in store for Solana, although a bounce into a lower high could be seen in the coming days.
Source: SOL/USDT on TradingView
The $170 area was a place where the bulls had a tenuous grip on just before Bitcoin slipped below $45k. On the back of that, SOL also crashed through the $152 support level and tested $130.
On the daily timeframe, buyers would not be much encouraged. Yes, it appeared SOL was overdue for a decent bounce from $130 and perhaps as high as $165-$170. However, there was also the possibility that SOL sellers step up the pressure when SOL neared $152.
The 55-period moving average (green) and 21-period SMA showed bearish momentum was strong, and in the past month, both of these MA’s have acted as resistance. This could repeat if SOL climbed toward $170.
To break the bearish trend of the past six weeks, SOL would need to establish an accumulation range or at least form higher lows and highs on the daily timeframe. That has not happened yet.
Rationale

Source: SOL/USDT on TradingView
The RSI was near 30 on the daily chart. This was a place where the RSI would generally find a bottom and bounce from. However, the RSI and the moving averages show that momentum remained in favor of the sellers.
The OBV also declined, setting a gradual series of lower highs and lower lows. Gradual, because the trading volume was nowhere close to the volume seen back in August and September.
The Bollinger bands width indicator climbed from recent lows, which suggested volatility was inbound.
Conclusion
Although SOL could see a bounce, the $152 and $170 levels are expected to serve as resistance levels. Sellers remained strong in the market, and Solana had yet not shown signs of stalling or stopping the downtrend of the past six weeks.


