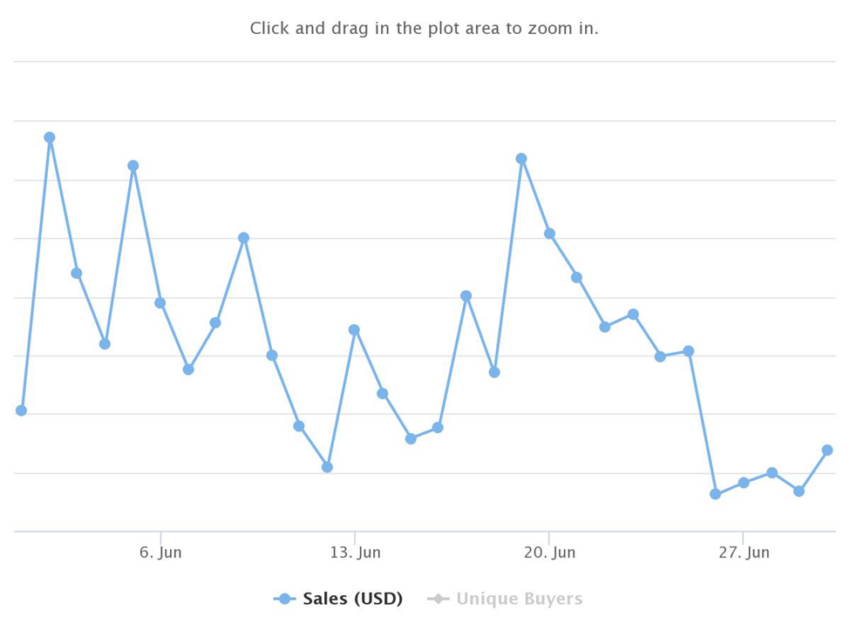
Solana non-fungible token (NFT) sales plummeted during June due to the bearish trends in the digital collectibles market.
Solana is the third-most successful blockchain, with a combined NFT sales volume of around $2.48 billion. According to Be[In]Crypto research, sales volume for the chain was approximately $91.52 million in June.
Despite the plunge, the project had higher monthly sales than WAX, Immutable X, Polygon, Binance Smart Chain, Avalanche, Waves, and Ronin. With that said, it still trailed Ethereum in volume.
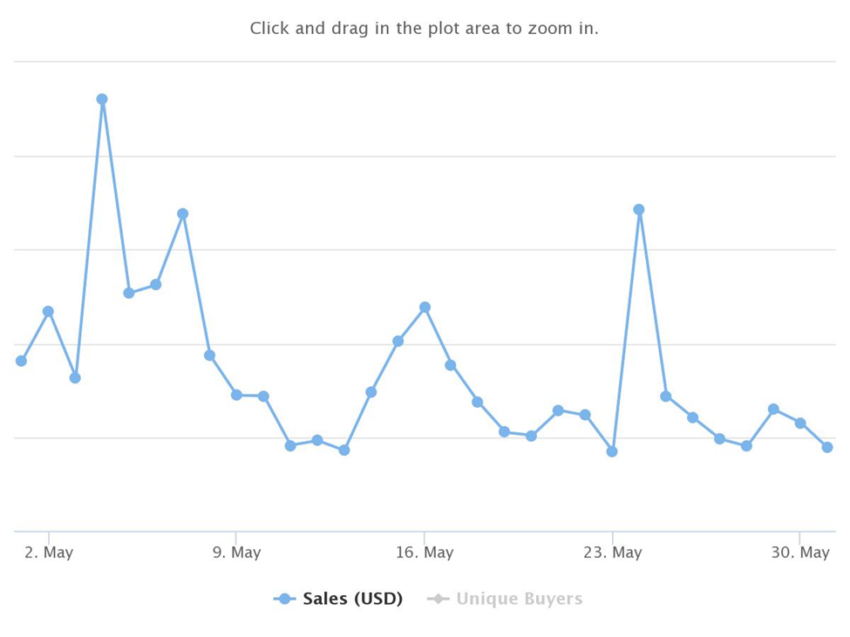
However, June’s figure was a 64% drop in sales from May. In May, the volume on the blockchain was $261.07 million.

New to Solana NFTs?
Launched in March 2020, Solana Labs and the Solana Foundation oversee the development of the ecosystem. The blockchain processes at least 3,000 transactions, which come at an average cost of $0.00025 per transaction.
Some of the popular NFTs on the platform include Chainers, Thug Birdz, Meerkat Millionaire Country Club, Frakt, Portals, Solsteads, Cosmic Condos, SolPunks, Blockstars, Akuma no Neko, Family Sol, Transdimensional Fox Federation, Aurory, Degenerate Ape Academy, Rogue Sharks, Infinity Labs, Galactic Geckos Space Garage, Solana Monkey Business, Boryoku Dragonz, and Pesky Penguins.
Why the waning sales?
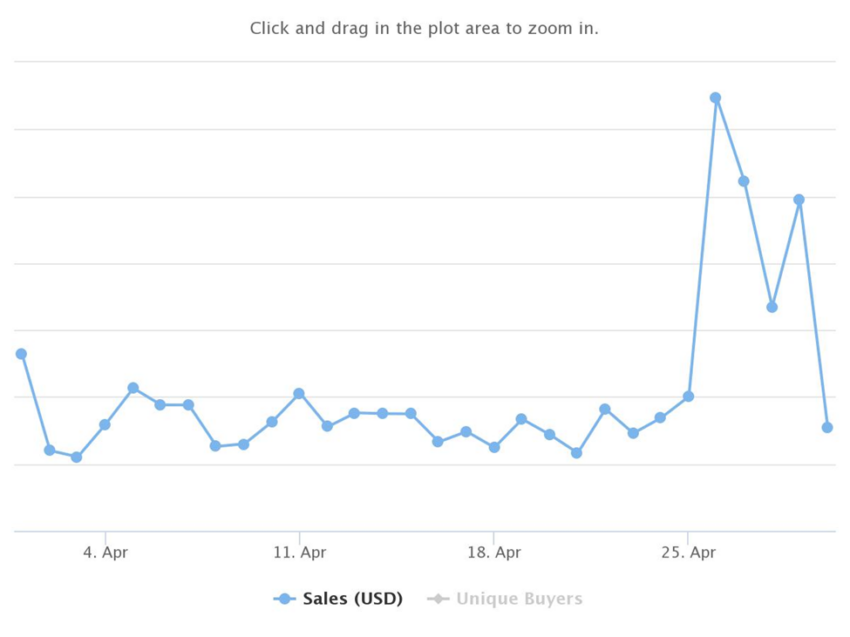
The fall in average sale value was the reason for the sinking NFT sales. Despite reaching an all-time high in monthly sales volume during April, the average sale value in June was much lower.
In June, the average sale value of an NFT was $58.50, and this was a 79% decrease from April’s $387.43.
Volume for April was approximately $311.55 million.

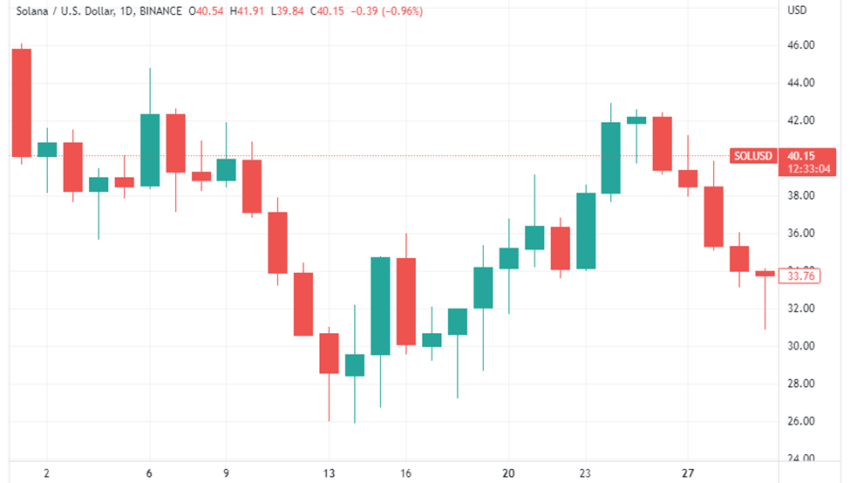
SOL opened on June 1, with a trading price of $45.77, reached a monthly high of $45.95, tested a monthly low of $26.06, and closed the month at $33.59. Overall, this equates to a 26% decrease between the opening and closing price of SOL in June.

Disclaimer
All the information contained on our website is published in good faith and for general information purposes only. Any action the reader takes upon the information found on our website is strictly at their own risk.


