Disclaimer: The findings of the following analysis are the sole opinions of the writer and should not be considered investment advice.
Bitcoin [BTC] faced rejection at the $21.6k mark. The $21.5k and $23.2k levels were strong resistance levels, and Bitcoin faltered at the first hurdle. This saw a drop across the altcoin market as well. Solana [SOL] pushed as high as $39 but was forced to pull southward. It had some support at $33.8 and $31.8. Now, the question is- Can the buyers defend these levels?
SOL- 1 Hour Chart
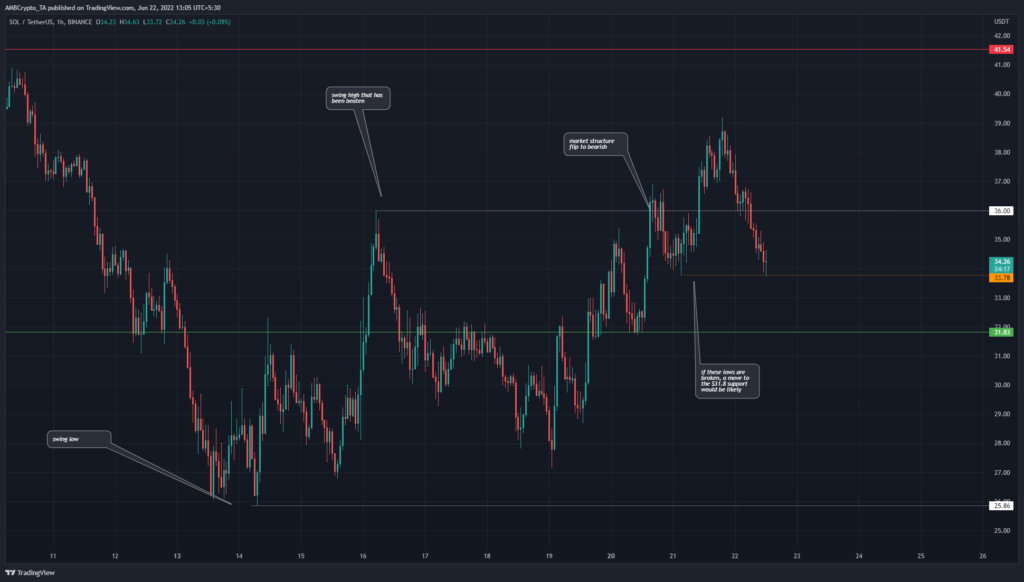
In the past week, the $36 and $25.86 were key swing high and swing low levels (dotted white) to watch out for. In the past couple of days, the swing high was broken to suggest that an uptrend could be initialized.
This bullish market structure break was followed by a higher low formed at $33.78 (orange) and a push toward the $41 resistance. However, this move was unable to clear the $39 mark.
At press time, the price had once again fallen to the $34 area. A session close beneath $33.78 would suggest further downside and a test of the $31.8 support level.
Rationale
The RSI fell below the neutral 50 line just as the price fell below the $36 mark, and retested the neutral 50 as resistance as well. On parallel lines, the OBV also fell beneath the trendline support of the past two days. This indicated that selling pressure had mounted in recent hours of trading.
The RSI has fallen below the 40 mark as well, which hinted at strong bearish pressure. Yet, it must be remembered that this was the hourly chart. Higher timeframes showed that momentum had not yet flipped bearish.
Conclusion
The market structure remained bullish. Even though the $36 mark was broken, the previous higher low at $33.78 was not yet broken. Until a session closed beneath this mark, it could be possible that SOL recovered and made another leg upward to $40.
On the other hand, the $19.8k level is a strong support level. If Bitcoin dropped beneath this level, it could drag Solana downward as well.


