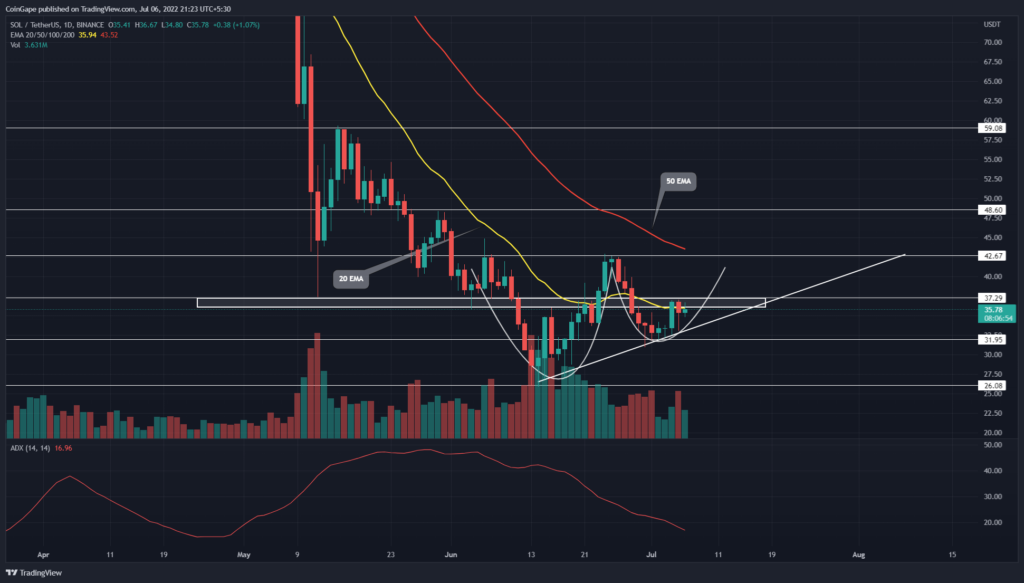
The Solana (SOL) technical chart shows the formation of a cup and handle pattern, which may lead the altcoin to $42.6. However, the coin price is currently struggling to complete the handle portion as the supply pressure at $37.2 undermines the bullish momentum.
advertisement
Key points
- A cup and handle pattern offers the nearest target of $48.6
- The $32 fallout would undermine the bullish pattern and plunge altcoin to $26
- The 24-hour trading volume in the Solana coin is $1.5 Billion, indicating a 5.58% gain
Source-Tradingview
The late June sell-off in the crypto market triggered a minor pullback in the SOL/USDT pair. As a result, the correction nullified nearly 60% of the gain from the previous recovery rally as the price plunged to the $32 mark.
However, the several lower price rejection candles at $32 accentuate the spikes in demand pressure brought by the 24% discount offer on SOL price. On July 4th, the altcoin rebounded from the $32 support with a long bullish engulfing candle.
Trending Stories
This reversal hints the trader’s sentiment is leaning toward buying on dips rather than selling on rallies. However, the buyers still struggle to surpass the immediate resistance of $37.3.
Anyhow, if the buyers breach the overhead resistance, the SOL price is likely to continue the formation of a cup and handle pattern and surge to $42.6 resistance. Moreover, the sustained may pierce the mentioned resistance in response to this bullish reversal pattern.
The pattern completion would drive the coin price 13% higher to $48.6.
Technical indicator
ADX indicator: A steady fast drop in ADX slope indicates the losing bearish momentum, which suggests a higher possibility for pattern completion.
advertisement
EMAs: Since early April, the fast-moving 20 EMA has acted as a dynamic resistance. However, with the recent roller-coaster ride in price action, the SOL price failed to sustain this EAM breakout and reassigned it as a viable resistance.
- Resistance level- $37.3 and $42.6
- Support levels- $32 and $26


