SOL price continues to drift lower following the long-term downward trend. The SOL buyers is out of the scene for more than a month. A further spike in the sell orders could trigger a downside momentum that could push it to a multi-month low.
- SOL price extends the loss for the second straight day on Friday.
- More downside could be expected if the price breaks below $75.0 on the daily chart.
- The price fell 15% in two days amid sustained selling pressure.
SOL price continues south movement
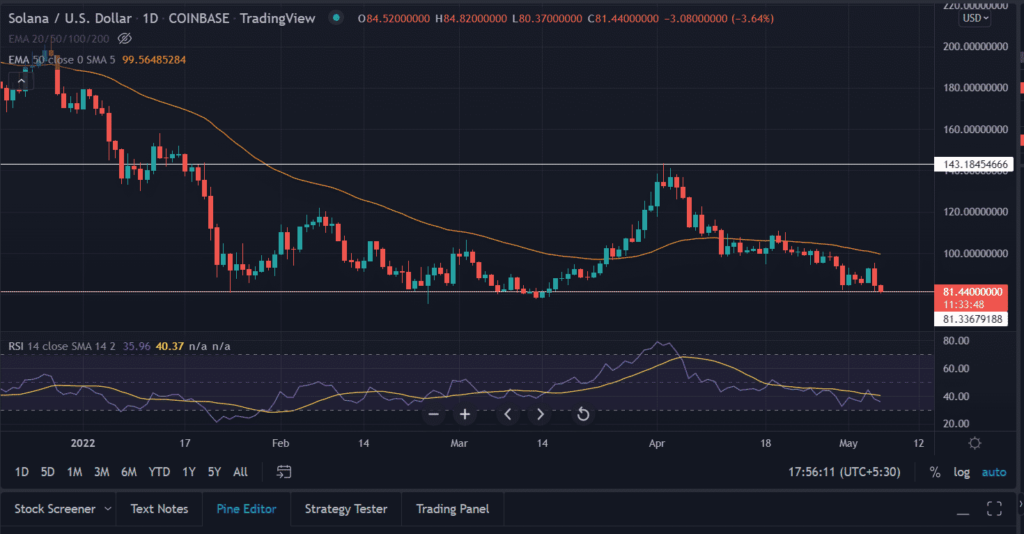
On the daily chart, the SOL price depreciated nearly 69% from the record highs of $260 made in November. The price tested the swing lows of $80.0 in late January, since then the horizontal support zone is being tested four times. Thus, a strong downside barrier for the price to sustain. For the whole time, the critical 50-day ema (Exponential Moving Average) plays the role of a strong upside barrier.
Only after March 24, the SOL buyers could muster the strength to pierce the moving average and highs of $143.57 on April 2. However, this rise in price proved to be a selling opportunity for the investors.
Currently, the price hovers near the multi-month low, a break below the level would produce more downside opportunities. The immediate would be $66.0, the levels last in August.
On the contrary, a resurgence in the buying momentum could push the price back to the previous high of $95.18. Further, an acceptance above the 50-day ema would generate the buying momentum to test $120.
Trending Stories
As of publication time, the SOL/USD trades at $81.56 down by 3.44% for the day.
Technical indicator:
RSI: The daily relative strength index hovers below the average line since April 19. The price traders in the oversold zone for quite a while still the reversion seems distant.


