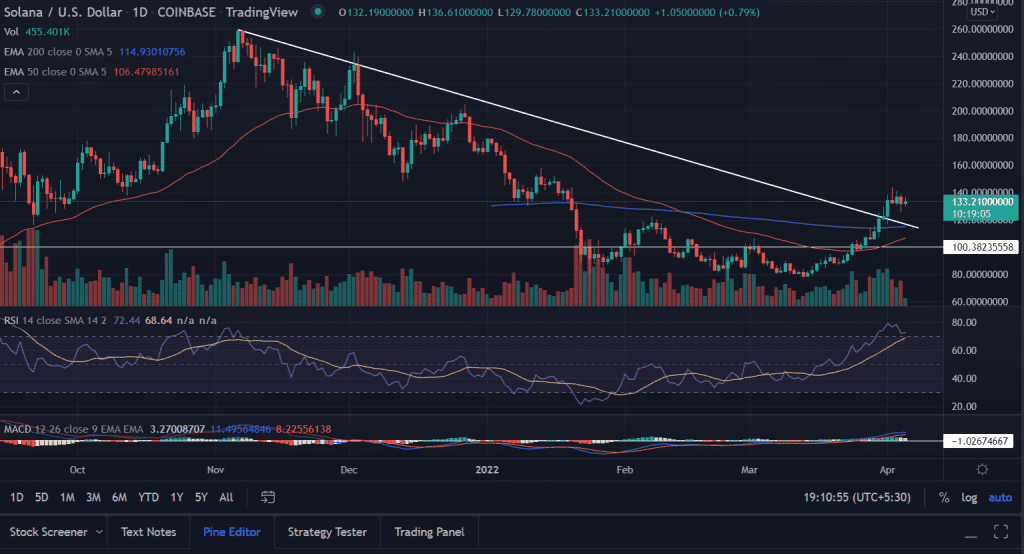
SOL price remains stable around on Tuesday. The price is in a downward trend since November after tagging the records highs.
- SOL price manages to trade in the green despite the previous session’s sell-off.
- The price remains pressured below the critical 50-day EMA.
- Expect more losses if the price closes below $16.0.
SOL price trades sideways
On the daily chart, the SOL price trades above the descending trend line from the record highs of $260. Further, the price trades above the critical 200-day EMA and 50-day EMA. This indicates an underlying bullish momentum in the asset.
SOL price stated the new series on a higher note. But the upside seems limited near $150. A resurgence in the buying momentum could strengthen the current price action at least in the short term.
If the price remains steady above the bearish sloping on a daily closing basis then the bulls will face upside hurdles. On moving higher an immediate resistance barrier is placed near the January 13 highs of $160. Next investors would crave for a horizontal resistance level near $180.0.
A sustained buying pressure would further push the price towards higher trajectories. The ultimate target for the bulls could be found at $200.0.
On the other hand, if the price fails to sustain the sessions low then it would invalidate the bullish reversal arguments. The bears would revisit the horizontal support level placed at $115 followed by the lows of March 27 at $98.0
As of publication time, SOL/USD trades at $133.34, up 0.72% for the day. The sixth-largest cryptocurrency by the market cap holds a 24-hour trading volume holds at $2,621,743,109 according to the CoinMarketCap.
Technical indicators:
RSI: The daily Relative Strength Index slipped below the average line. Currently, it reads at 45.
MACD: The Moving Average Convergence Divergence hovers below the midline with a neutral bias.


