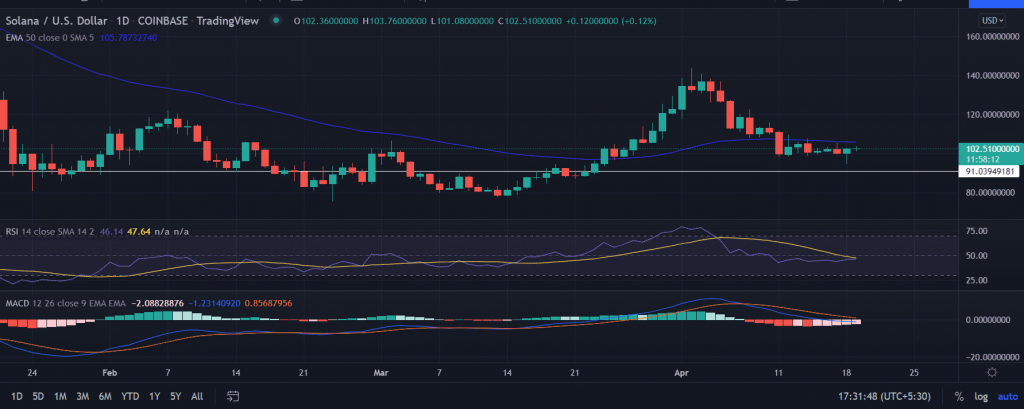
SOL price treads water with no clear directional bias. The recent price action shows signs of a consolidation that could result in a trend reversal as it approached a solid multi-week support zone on the daily time frame.
- SOL price trades with modest gains on Tuesday.
- Expect a bounce-back as the price harbors a crucial support zone around $100.0.
- However, the upside faces immediate resistance near the 50-day EMA.
SOL price consolidates to take the next step up
SOL price retraced nearly 30% from the swing highs of $140.0 and is currently hovering around the $100.0 level. From November 2021 to April 2022, the SOL price formed three distinctive lower highs and lower lows, which when connected using trend lines reveal a bearish pattern.
Currently, the price refuge near the critical support zone makes bulls hopeful of a quick recovery. However, clearance above the upside filter at the 50-day EMA (Exponential Moving Average) at $105.80 would be a healthy sign for the upside continuation.
A daily close above the moving average will pave the way toward further gains. Investors will seek the upside target at the highs of April 8 at 122.48. Next, the bulls would attempt to recapture the swing highs of $143.57.
Alternatively, if the price fails to hold the session’s low amid a spike in sell orders it would drag the price toward the horizontal support zone at $90.0.
Trending Stories
As of publication time, SOL/USD is trading at $102.46, up 0.08% for the day. The seventh-largest cryptocurrency is holding a 24-hour trading volume of $1,533,286,945 according to the CoinMarketCap.
Technical indicator:
RSI: The daily relative strength index hovers below the average line since April 5. However, attempts to pierce above it that could result in an upward price movement.
MACD: The moving average convergence divergence stays in the positive zone with a neutral bias.


