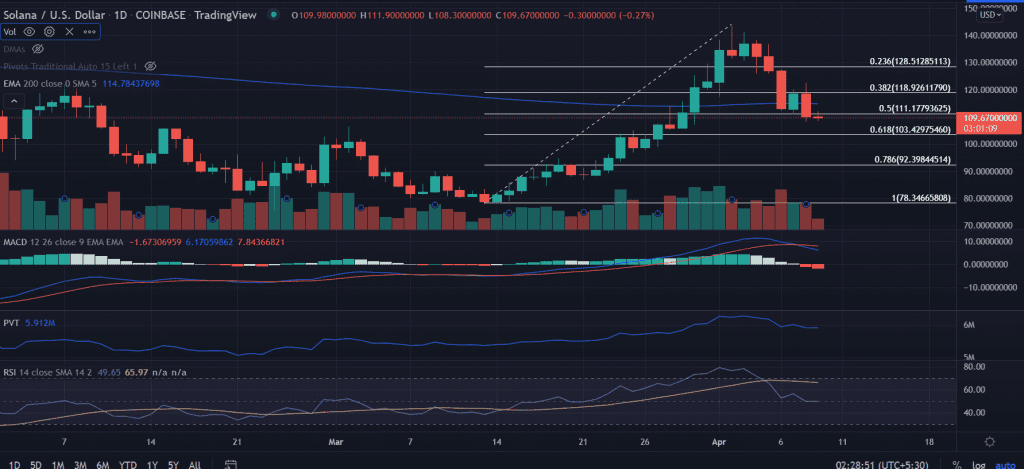
SOL price continues to trade lower after a massive fall in the last session. Further, the price is expected to continue south following the big red candlestick. However, the formation of a ‘Doji’ suggests a tug of war between bulls and bears.
- SOL price remains muted with no meaningful price action.
- More downside toward if the price approached 0.618% Fibonacci retracement level.
- The upside remains pressured near the 200-day EMA.
SOL price moves south
On the daily chart, the SOL price is struggling below the 0.50% Fibonacci retracement, which is extending from the lows of $77.74. A day before that, the price sliced the critical 200-day EMA (Exponential Moving Average) signaling problem for the SOL buyers.
SOL price tested the lows of March 31 at around $107. Thus, marking it as a reliable demand zone. But a resurgence in the selling could push the price to test the horizontal support level at $100.
On the other hand, a daily close above the 200-day EMA at $114.84 could be a sign of reversal in the trader’s mood. On moving higher, the first upside target could be located at the highs of April 8 around $122.48.
Next, investors shall meet the supply zone at the 0.236% Fibonacci retracement level at $128.37.
As of writing, SOL/USD is trading at $110.20, up 0.20% for the day. The seventh-largest cryptocurrency by the market cap is holding a 24-hour trading volume of $1,507,035,836 according to the CoinMarketCap.
Technical indicators:
RSI: The daily Relative Strength Index remains neutral at 50. The oscillator slipped below the average line on April 5.
MACD: The Moving Average Convergence Divergence advances towards the negative zone.
PVT: The Price Volume Trend declines from the higher reading in correlation with the price.


