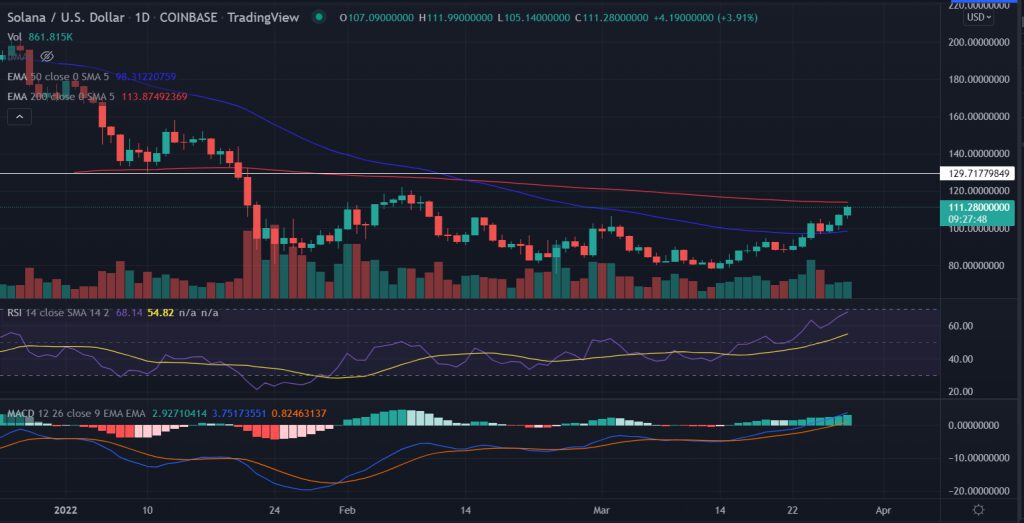
SOL price opened the week on a higher note. The price extended the previous week’s gains as it locked a 24% ascent on a weekly basis. After opening lower SOL recovered quickly to tag the session higher levels, last seen in February.
- SOL price trades higher as the fresh trading week begins.
- Expect more upside towards $130.0 above the 200-EMA.
- The momentum oscillators turn favorable to bulls.
As of publication time, SOL/USD is trading at $111.34, up 3.92% for the day. The eight-largest cryptocurrency by market cap 24-hour trading volume is holding at $2,481,911,734 as per the CoinMarketCap.
SOL price continues north
On the daily chart, the SOL price attempts to move beyond the critical 200-EMA (Exponential Moving Average) at $113.87. The sustained buying momentum in the asset keeps the gains intact since March 14.
SOL made a ‘Rounded bottom’ formation over a month. The rounded bottom pattern is a bullish reversal formation that formed after a long-term downside movement in the asset.
Now, a daily close above the mentioned moving average will meet the upside target at $130.0.
Best optionsEarnEarn 20% APRClaim5 BTC + 200 Free SpinsWalletCold Wallet
On the other hand, a spike in sell order or a shift in the bullish sentiment could weigh on SOL price. In that scenario, a move toward the 50-day EMA, which acted as immediate downside support at $98.0 cannot be ruled out.
Furthermore, a break below the above level might accelerate the selling and the bears would target $80.0.
SOL price depreciated nearly 70% from the record highs of $260. The price capped the downside risk and consolidated after falling further lower in late January.
Technical indicators:
RSI: The daily Relative Strength Index moved sharply above the average line on March 15, and continued to trade higher. Currently, it reads at 68.
MACD: The Moving Average Convergence Divergence holds above the midline with a strong bullish bias.


