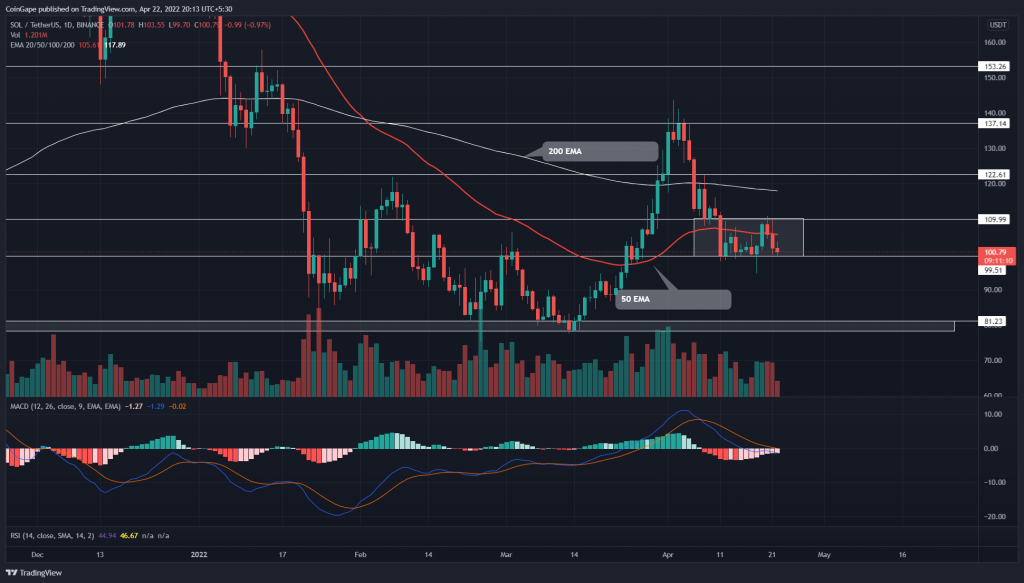
The Solana(SOL) price has been resonating between the $110 and $100 level for nearly two weeks, indicating a no-trading zone. Furthermore, indicators reflect a sell signal which could bolster the $100 breakdown. However, a genuine breakout and daily-candle closing are needed to confirm further price movement.
Key points
- The potential breakdown from $100 may tumble the SOL price by 18%
- The flattish EMAs(20, 50, 100, and 200) suggest an overall sideways rally.
- The 24-hour trading volume in the Solana coin is $1.7 Billion, indicating a 1.98% gain.
Source-Tradingview
The V-top reversal from the $135 tumbled the SOL price by 25% and dropped it to $100 psychological support. However, the 50 DMA aligned with this support stalled the sellers from incurring any further losses.
The SOL price has been hovering above the $100 support for nearly two weeks but couldn’t rise above $110. Thus, this consolidation reflects a minor range and suggests a short pause before the upcoming directional move.
A breakout from either range level may bring a good entry opportunity for the subsequent rally. If sellers breached the $100 support, the altcoin would sink 18% to the last quarter’s support of $80.
Trending Stories
However, the range holds a bullish breakout possibility as well, which could form a higher low at $100 and push the price back to $137.
Therefore, the breakout and daily candle closing beyond the range limit holds the final decision.
Technical indicator
The SOL price trading below the crucial EMAs(20, 50, 100, and 200) suggests that the path to least resistance is downward. Moreover, the 20-and-50–day EMA is poised for a bearish crossover, encouraging a $100 support breakdown.
The MACD indicator shows the downsloping fast and slow lines are penetrating the bearish territory, accelerating the selling momentum.
- Resistance level- $110 and $122
- Support levels- $100 and $81


