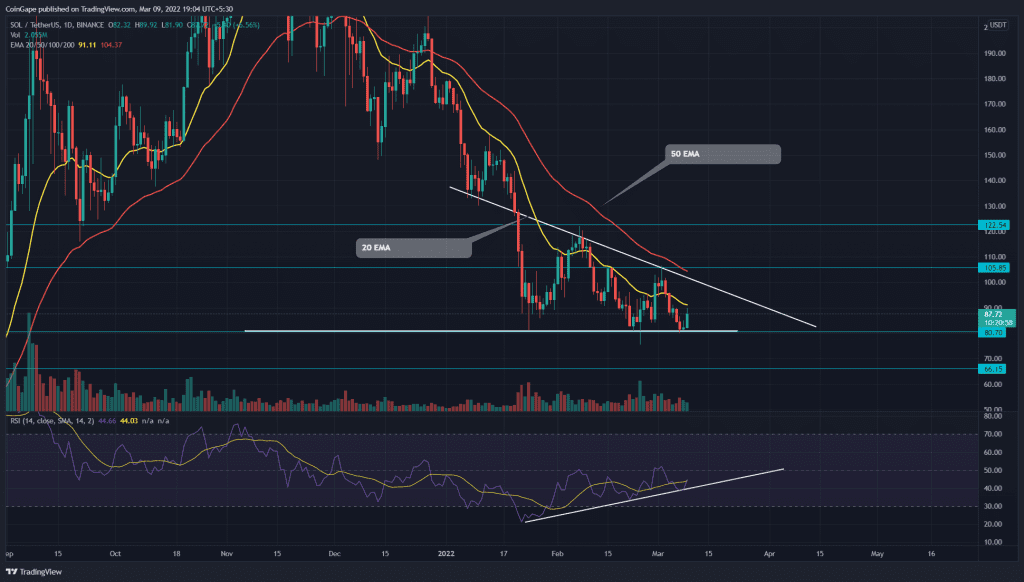
On Wednesday, the crypto market experienced a sudden pump and rebounded several altcoin from their crucial support. The Solana (SOL) price faced a similar outcome as it bounced back from its monthly support, registering an 8% intraday gain.
Key points:
- The daily-RSI chart shows an evident bullish divergence.
- The SOL price forms a morning star pattern at $80 support
- The 24-hour trading volume in the Solana coin is $2.57 Billion, indicating a 12.03% gain
Source-Tradingview
The Solana (SOL) price action resonates within a descending triangle pattern. On March 2nd, the altcoin turned down from the falling trendline ($105) and plunged to the $80 neckline. The buyers have aggressively defended this support for more than a month now, preventing the sellers from extending any further losses.
Today, the altcoin jumps from this $80 support with an evening star pattern, allowing the traders to set up another recovery. Furthermore, the coin price nearing the apex of the bearish pattern can soon provide a decisive breakout.
In contrast to SOL price action, the daily-RSI chart shows an upside rally. This positive divergence in the RSI slope indicates the increasing underlying bullishness in the market, providing a better possibility for a bullish breakout from descending triangle pattern.
However, the down-sloping crucial EMAs(20, 50, 100, and 200) maintain an overall bearish trend.
Descending Trendline Restrains The buyers’ Recovery Attempt

Source- Tradingview
In SOL buyers manage to breach the overhead resistance trendline, the buying pressure would intensify and rally the coin to $105 resistance followed by $122.
Alternatively, if sellers dumped the coin price below the $80 support, the renewed selling would trigger a free fall to the $66 mark.
Anyhow, the range between the descending trendline and the $80 support should be considered as no-trading zone, and the coin traders should wait for a guinea breakout before entering a new position.
- Resistance level- $105, $122 and EMAs(20, 50, 100, and 200)
- Support levels- $80, $66


