Despite breaking out from a six-month descending resistance line, Solana (SOL) has failed to sustain its upward movement and has returned to its yearly lows.
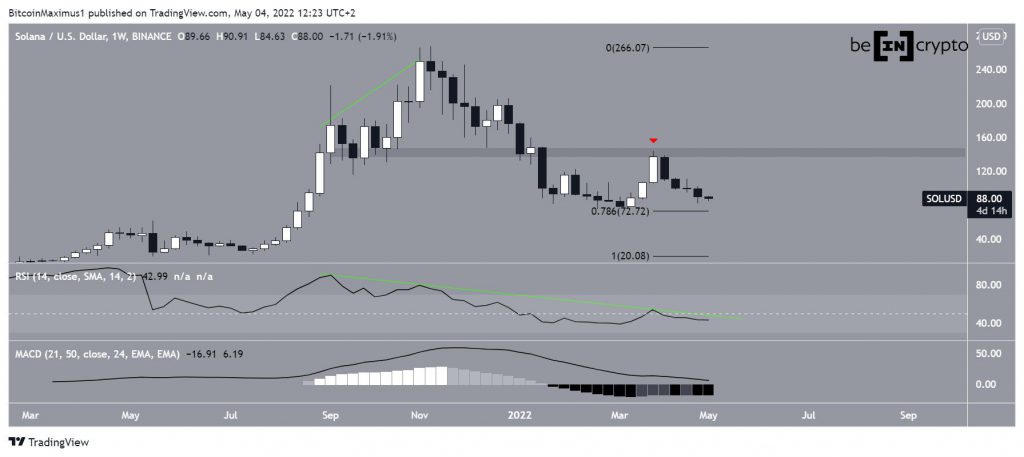
SOL has been falling since reaching an all-time high price of $267.5 on Nov 8. The downward movement has so far led to a low of $75.34 on Feb 24. The ensuing bounce served to validate the $73 area as support. This is the 0.786 Fib retracement support level.
However, the price failed to sustain the upward movement and was rejected by the $140 area, validating it as resistance (red icon).
Technical indicators in the weekly time frame are bearish. Firstly, the downward movement was preceded by bearish divergence in the RSI (green line). The trendline of the divergence is still intact, and the RSI is now below 50.
Secondly, the MACD is decreasing and has nearly crossed into negative territory.
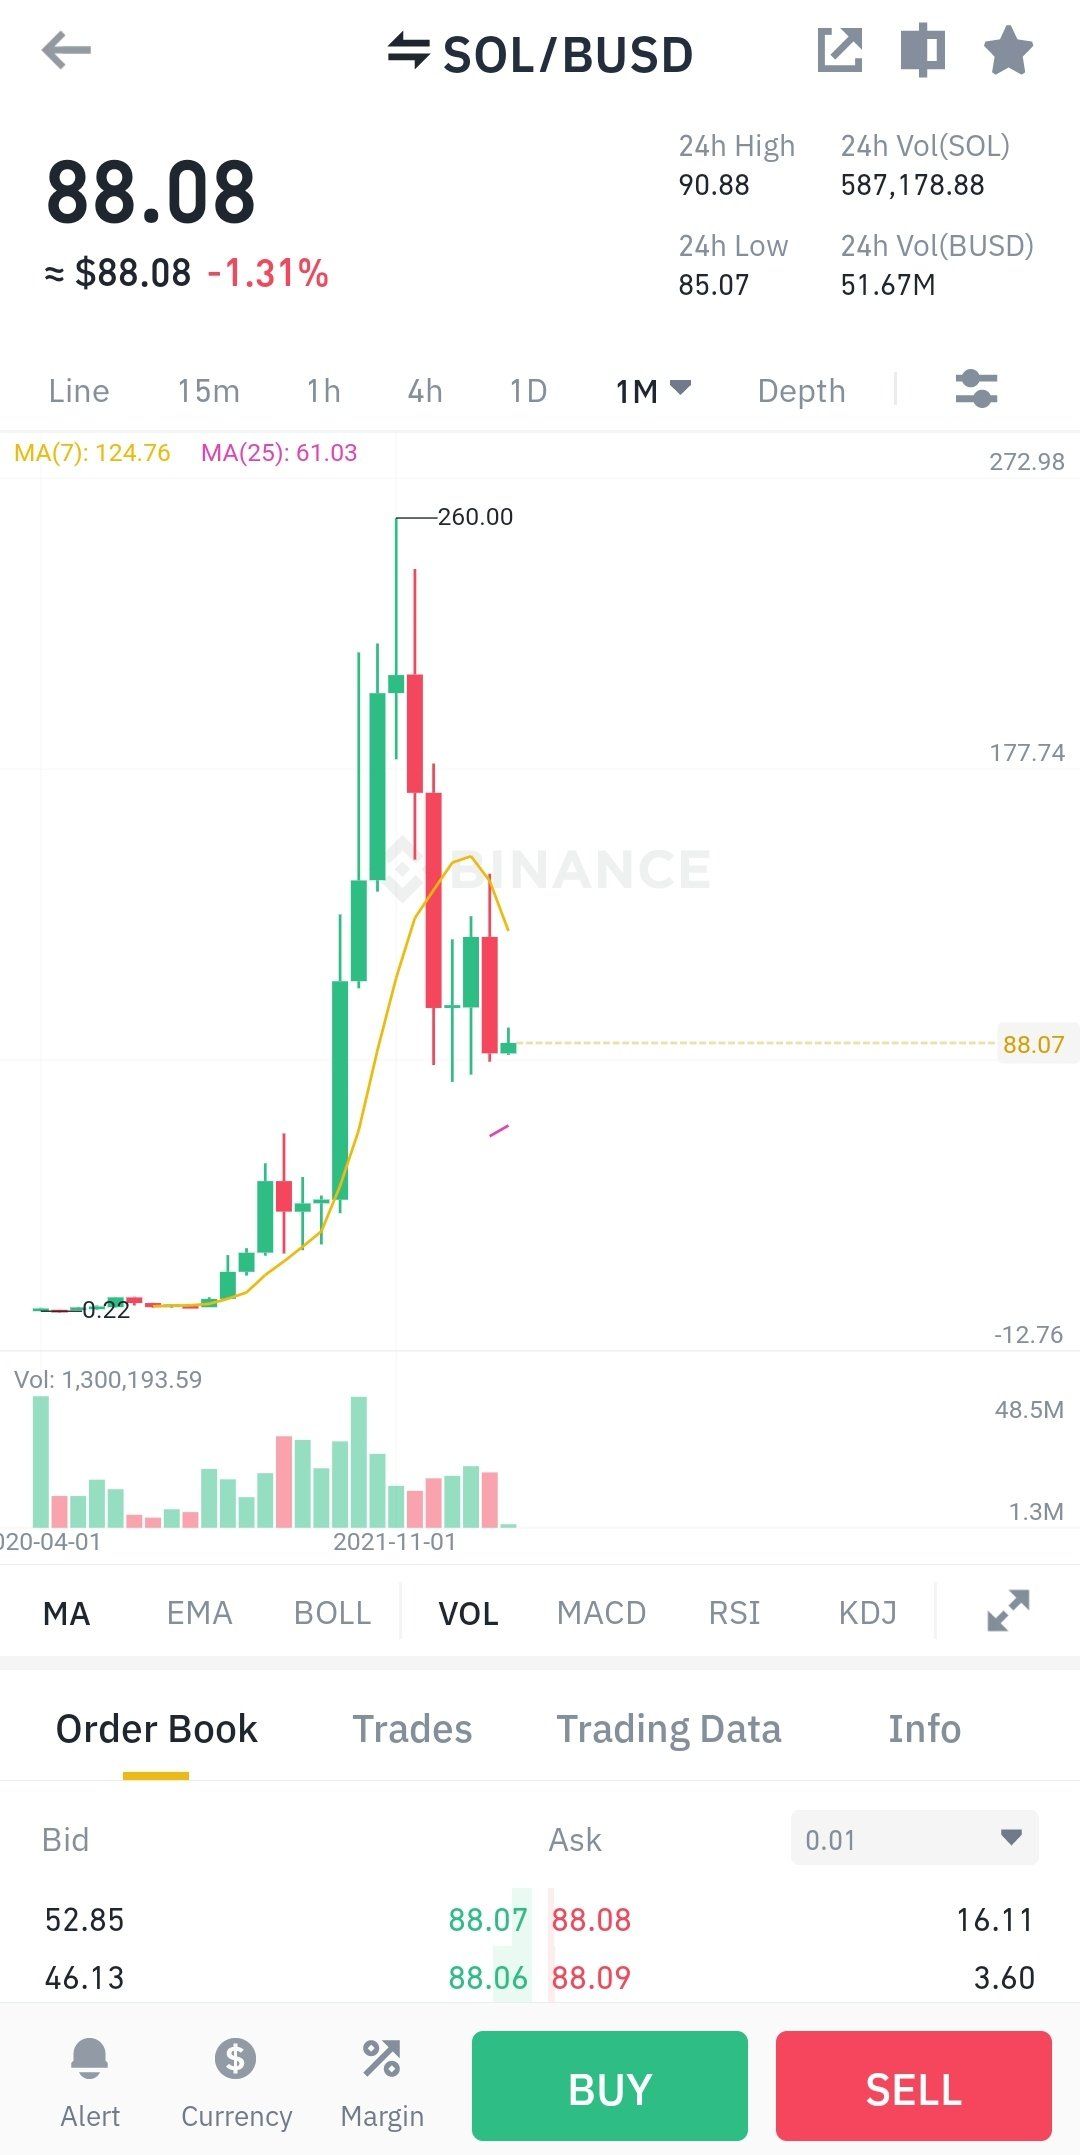
Cryptocurrency enthusiast @cryptosanthoshg tweeted a chart of SOL, suggesting that the coin is being accumulated.
However, readings from the weekly time frame suggest that the trend is bearish instead. Therefore, a look at lower time frames is required in order to determine if the trend is bullish or bearish.
Breakout cannot be sustained
The daily time frame does not cancel out the bearishness from the weekly one.
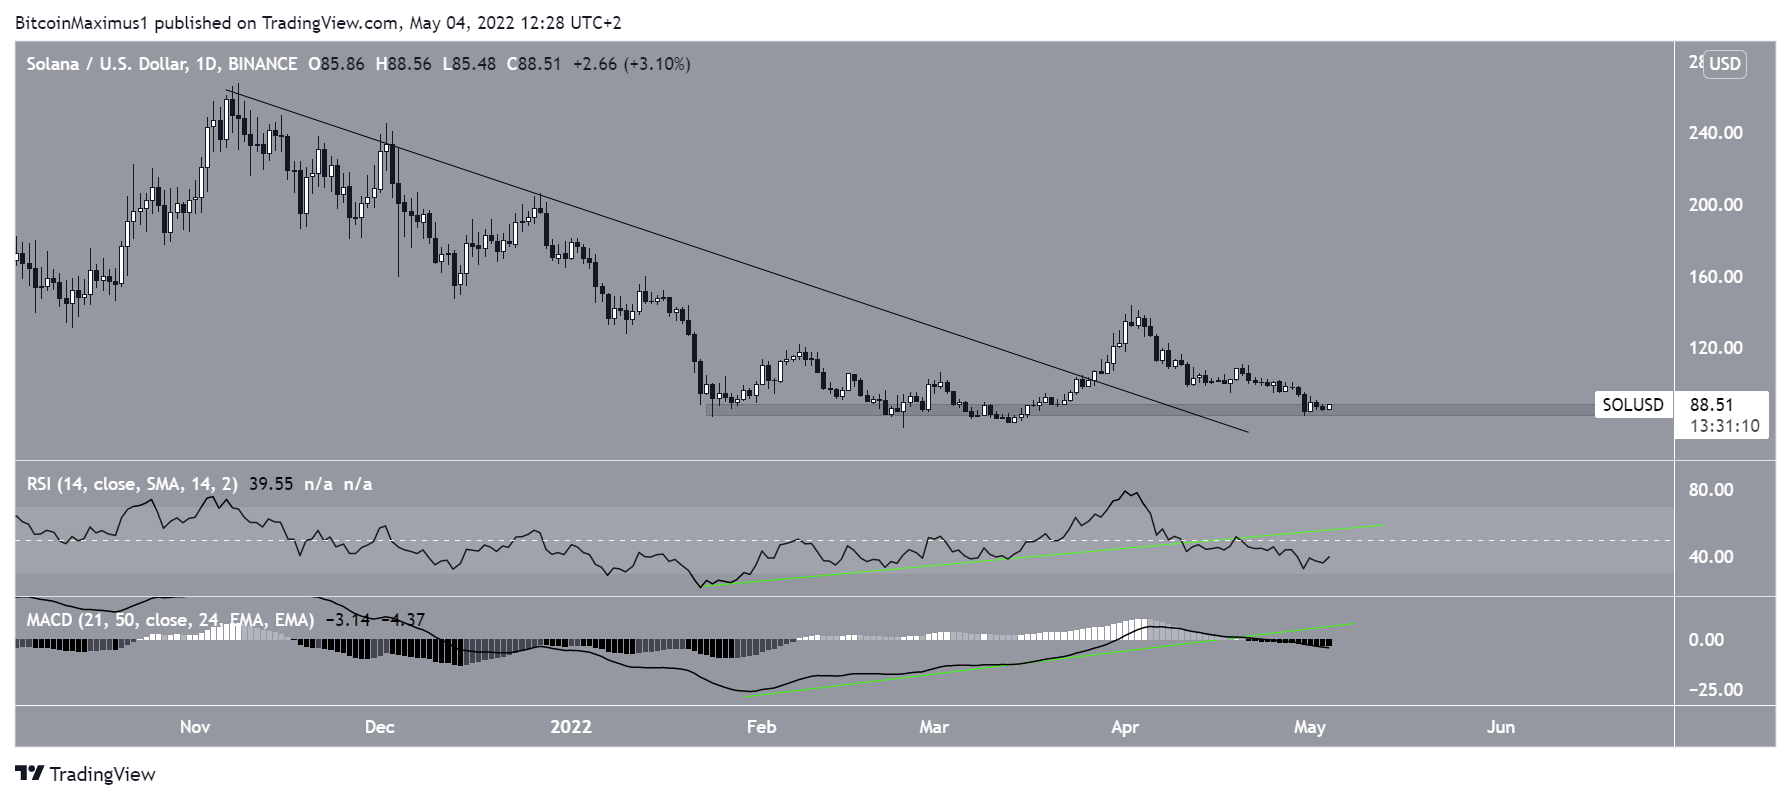
While SOL has broken out from a descending resistance line that had been in place since the all-time high, it has failed to sustain the upward movement. It is now back to the $80 support area, which has been in place since Feb. This is the fourth touch of the area. A breakdown below it could greatly accelerate the rate of decrease.
Technical indicators in the daily time frame are bearish. While both the RSI and MACD had generated bullish divergences prior to the breakout, their trendlines are not intact. This is a bearish sign, suggesting that the bullish structure for SOL is not intact either, despite the breakout from the descending resistance line.
Additionally, the RSI is now below 50 and the MACD negative. Both of these are considered bearish signs.
SOL/BTC
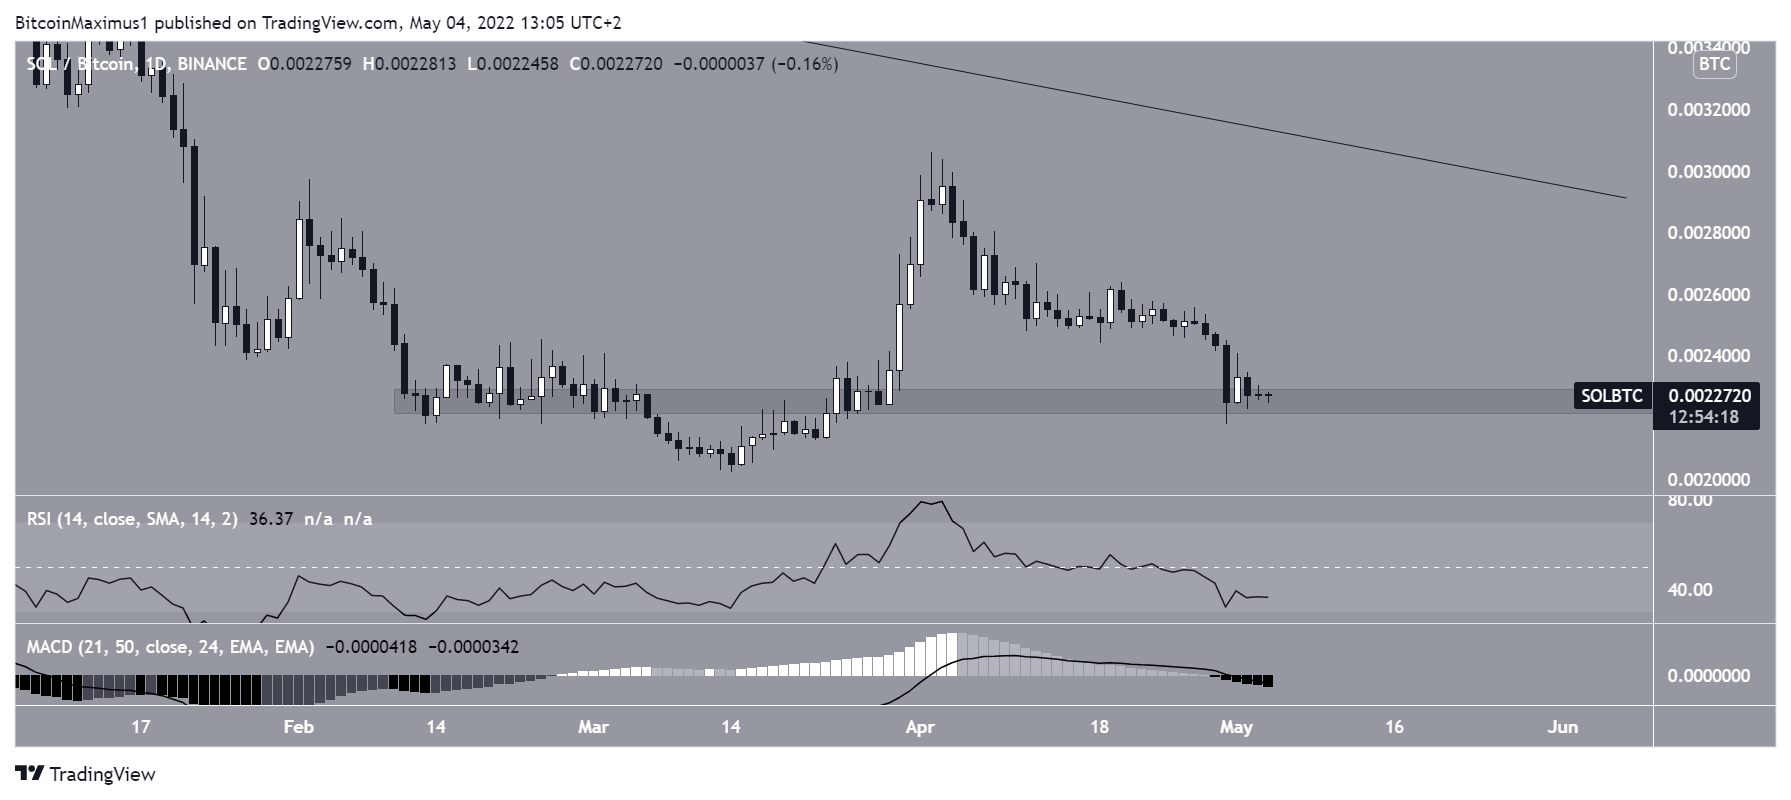
The SOL/BTC pair is slightly more bullish than the USD pair due to the reclaim and subsequent validation of the 225,000 area as support. However, there are no bullish reversal signs, since both the RSI and MACD are falling.
Therefore, the trend cannot yet be considered bullish.
For Be[in]Crypto’s latest Bitcoin (BTC) analysis, click here
Disclaimer
All the information contained on our website is published in good faith and for general information purposes only. Any action the reader takes upon the information found on our website is strictly at their own risk.


