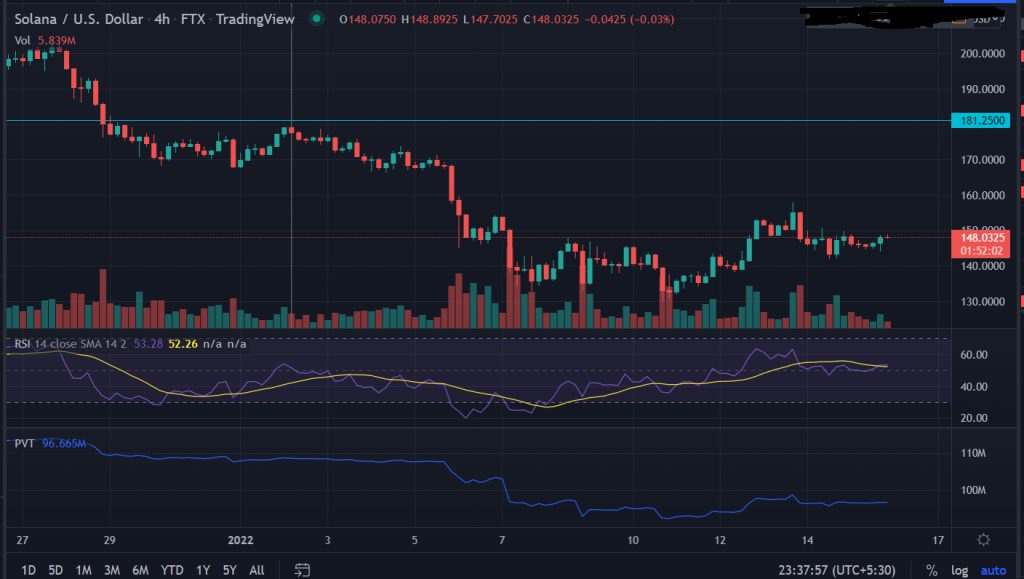
Solana’s price remains higher and oscillates in a trading range. The digital currency faces upside pressure near $157.87. However, sellers failed to capitalize on the downside trend. The current market cap is $46,634,116,790 USD in the past 24-hours.
- Solana (SOL) gains remain consolidated in a tight range.
- SOL bulls are not ready to give up easily, price action suggests upside continuation.
- The momentum oscillators trade in a bullish trajectory.
Solana struggles below $150 inside the downward channel
SOL has shown some bottom buying from the lows of $130.93 with almost 20% gains in just 3 days. However, the bulls face some resistance near $157. The price consolidates in a trading range of $134 and $144 since January 7, the range breaks on January 12. The rising PVT (Price Volume Trend) indicator supports the underlying bullish current.
On the 4-hour chart, The RSI (Relative Strength Index) trades at 55 with a bullish crossover, which indicates the price could move beyond Thursday’s high. Market participant next looks to move towards the $170 psychological mark.

On the daily chart, Solana’s (SOL) price has taken support near $131.32 and moved back to $150. A daily close above the January 13 high of $157.87 would motivate bulls to take out the high of January 5, which is placed at $171.26. On the other hand, if SOL trades below $141.91, the low of January 14 then it would negate the continuation of the upside momentum. However, the rising momentum oscillator and stable volumes suggest that bulls are not in a mood to give up easily. In the short term, the upside till the level of $181 is not ruled out.


