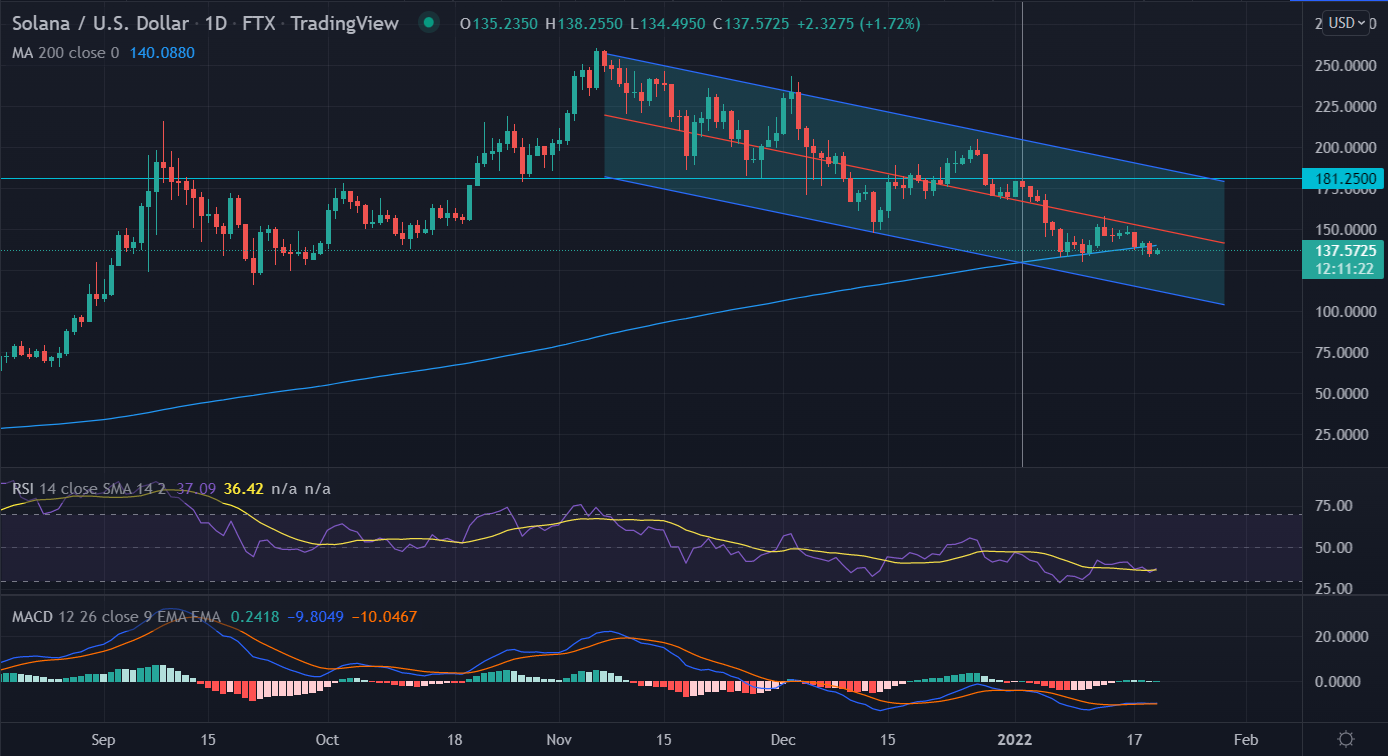
Solana’s (SOL) price has been falling continuously since November 7. Now, the price is struggling below the 200-EMA (Exponential Moving Average) at $140.09. But in today’s session, SOL rose almost 2% with a more than 50% dip in volumes at $7, 44,327,013 in the past 24-hour day.
- Solana’s (SOL) price is revising the $136.00 demand zone, looking for an uptrend.
- A bullish upside from this congestion will result in more than 20% ascent to the weekly resistance barrier at $181.0.
- Price moves in a downward channel since ATH made in November near $259.
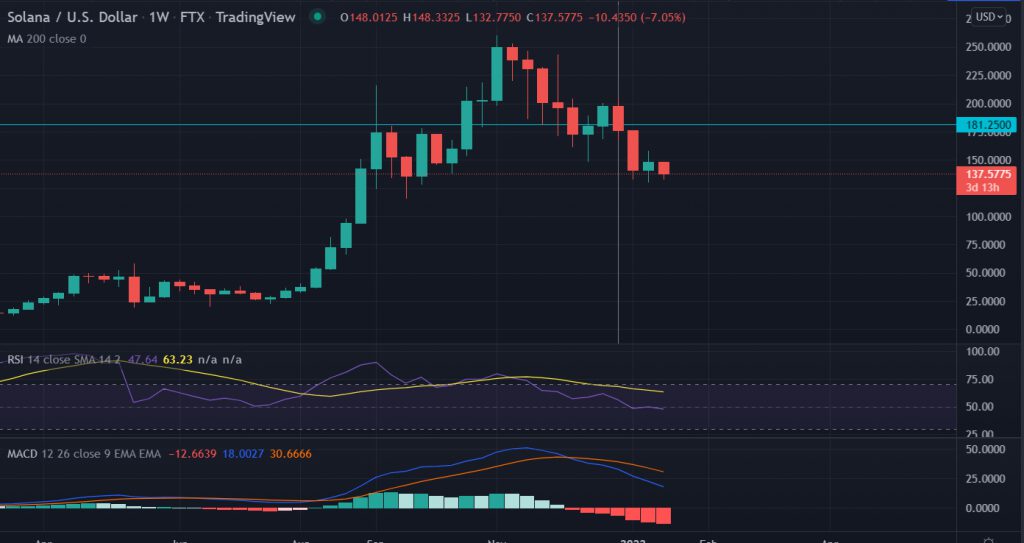
SOL seeks 16% correction on the break of weekly lows
Speaking technically, the week started on a lower note and continued to perform negatively. It would be interesting to watch if the price closes below the psychological level of $137.50. The first downside target could be found at the weekly September 20 lows at $115.88.
Moving onto the daily chart frame, the bulls once again lose control near the recent highs of $157.87 made on January 13. After that the price breaks below the 200-EMA, further building up the pressure on the bulls. SOL bears’ could test the next confluence zone near the horizontal support of $120.0.

An oversold daily Relative Strength Index (RSI) shouts a technical bounce back is pending after the continuous downtrend in the price. But, the MACD (Moving Average Convergence Divergence) in the negative zone is throwing a challenge for the bulls.
Alternatively, a decisive break above the January 13 of 157.56 could see the upside towards the psychological level of $181.25 in the short term.


