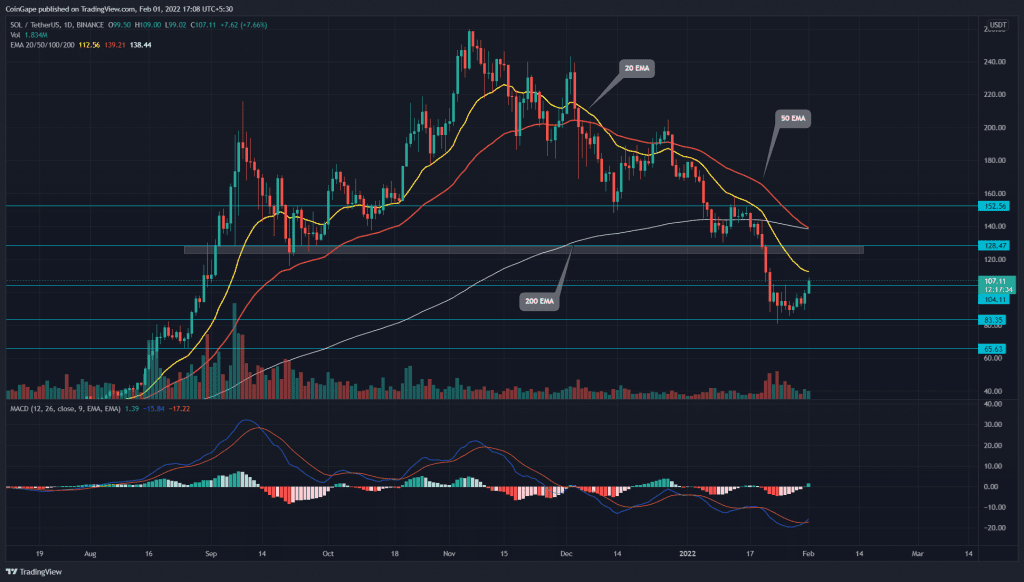
During the recent bloodbath in the crypto market, the SOL price lost the 50 retracement level($128) and plummeted to $81.23. After a week of consolidation of hovering above this support, the buyers breach the immediate resistance of $104. Sustaining above this resistance, the bulls have a recovery chance
Key technical points:
- The 50-and-200 EMA are soon to give a death crossover
- The daily MACD indicators bullish crossover projects a buy signal
- The 24-hour trading volume in the Solana coin is $2.8 Billion, indicating a 154.5% gain
Source-Tradingview
The correction phase in SOL price made a new lower low at $81.23, indicating a 68% loss from the All-Time High mark of $260. The bulls managed to defend the $83.5 support, allowing the coin price to resonate in a narrow range between the said price and $103.7.
However, today the buyers seem ready to escape this consolidation with a bullish breakout from overhead resistance. The price is yet to provide a candle closing which gives the first signal for recovery opportunity in SOL.
The MACD indicator shows a bullish crossover among the MACD and signal lines in the bearish region, supporting the current resistance breakout.
However, the crucial EMA line shares a bearish outlook as the 50 and 200 EMA are poised to give a death crossover. These bearish crossovers are known to encourage the ongoing bear attack. Moreover, the buyers also have to face the dynamic resistance of 20 EMA interrupting any bullish rally since January.
4-hour 100 EMA Restrict SOL Price Recovery

Source- Tradingview
The SOL/USD 4hr-chart shows the coin price has provided a candle closing above the $104 resistance and is currently in a retest phase. However, the pair is facing strong resistance from the 100 EMA, displaying a higher price rejection candle.
If sellers stepped in again the Alt would plunge back to the tight range, and along with it, a possible breakdown of the recent low points($81.3).
- Resistance level- $115, $128
- Support levels- $104, $98


