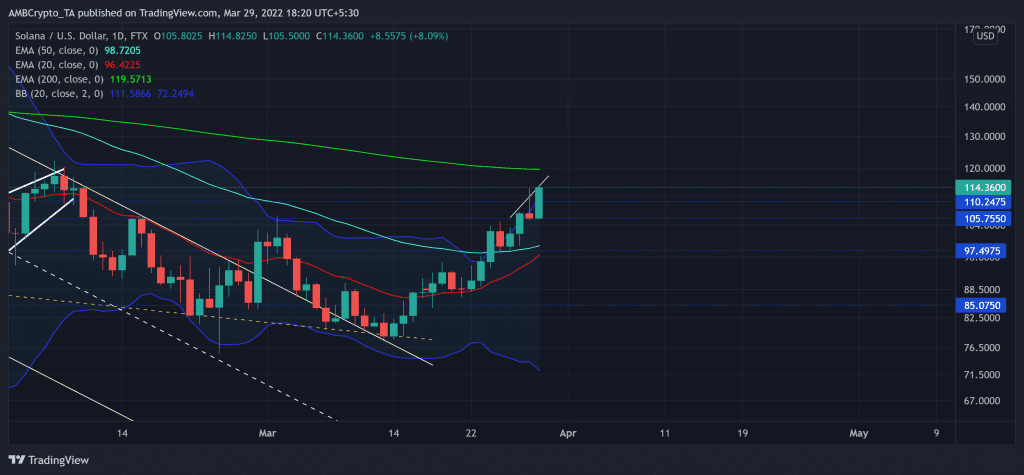
SOL finally broke out of its descending channel (white) after rising from the long-term $85-support. Meanwhile, the bulls managed to find a close above the 20 EMA (red) and the 50 EMA (Cyan).
A potential close below the immediate trendline resistance would position the alt for fall towards the $105-mark. Then, the bulls would likely continue their rally whilst the 20 EMA endeavored to cross the 50 EMA. At press time, SOL traded at $114.36, up by 3.7% in the last 24 hours.
SOL Daily Chart
The recent bearish phase saw a staggering 71% retracement from its ATH as SOL dropped through crucial price levels. During this descent, the 20 EMA served as a strong selling point that shunned major bullish rallies. After witnessing two bearish flags during this phase, the buyers finally started to build up pressure from the $85.
The bulls were visibly keen on upholding the six-month horizontal support at the $85-mark. Thus, they found a close above the long-term down-channel. Further, they triggered a 45% rally in the last 15 days.
Also, as the distance between the 20 EMA and 50 EMA (cyan) gradually declines, the bulls hinted at increasing their influence in the days to come. From here on, with the price constantly testing the upper band of the Bollinger Bands (BB) for the last five days, SOL could observe a setback towards its 20 EMA before the bulls reinforce their intentions.
Rationale
The RSI depicted a one-sided bull momentum as it approached the overbought mark on its daily chart. A possible reversal from here would not be perplexing for the investors.
Moreover, the OBV was on a slight downtrend in the last two days while the price peaked. So, a reversal from its resistance would confirm a bearish divergence that could cause a setback for the buyers in the near term.
Conclusion
SOL depicted an overvalued position on its BB and was on the brink of an overbought mark on the RSI. Thus, a potential fall back towards the $97-$105 zone before the continued uptrend seemed likely in current circumstances. If 20 EMA crosses the 50 EMA, the chances of toppling the 200 EMA would brighten up.
Besides, considering the impact on the broader sentiment of Bitcoin’s movement would also be vital in making a profitable move.


