Published 8 seconds ago
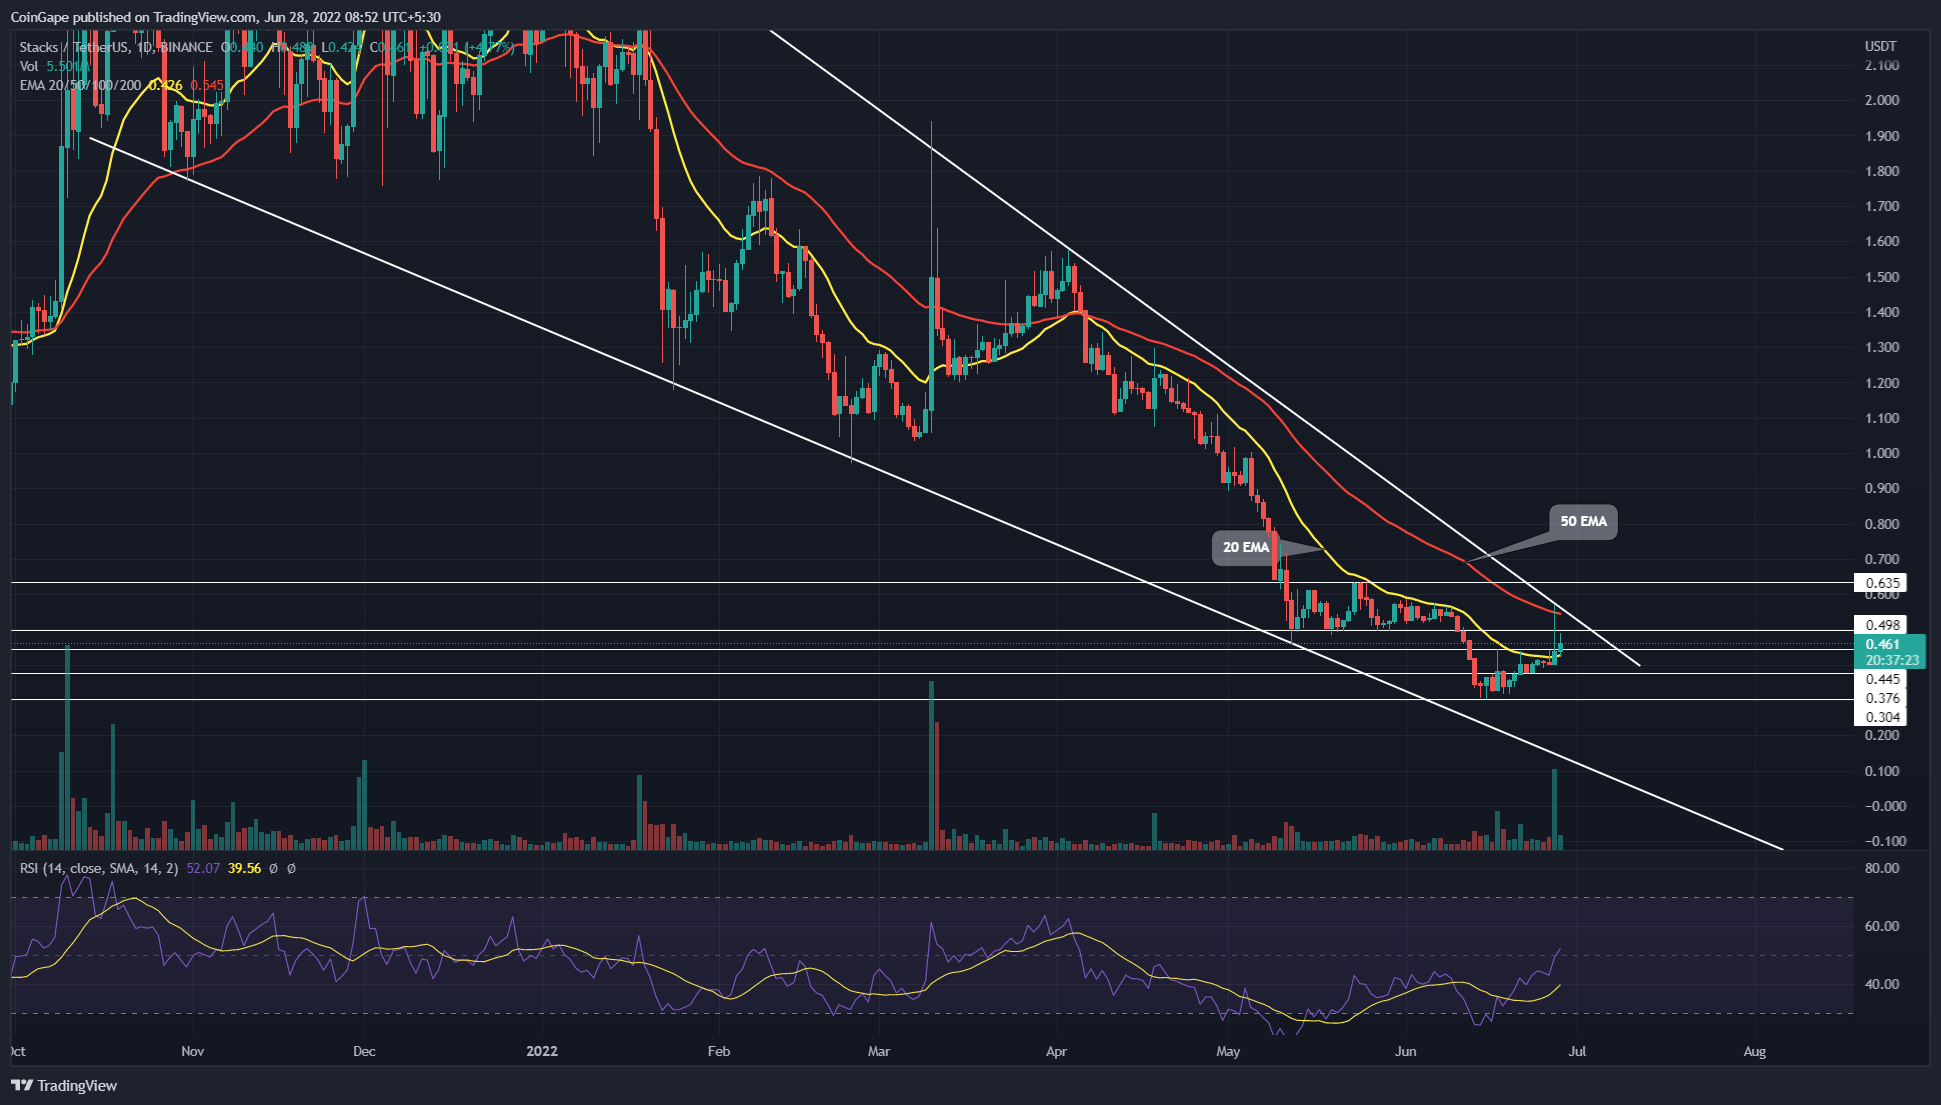
The Stacks(STX) price is one of the few cryptocurrencies that have been positive in the last 24hr. Since last week, the altcoin has recovered 40% as it bounced back from the $0.3 support and retested the immediate resistance of $0.46. However, today the coin chart showcased a failed attempt to surpass the mentioned resistance, suggesting a bearish reversal.
advertisement
Key points:
- The STX chart flashes a reversal possibility from the descending resistance trendline.
- Bear cycle within the wedge pattern tease 30% fall
- The intraday trading volume in the Stacks coin is $241.5 Million, indicating a 341.5% gain.

Source- Tradingview
The STX/USDT technical chart represents the six-month downtrend inside a falling wedge pattern. Multiple retests to these downsloping trendlines indicate that coin traders strictly respond to the pattern’s levels. Furthermore, the downfall recently plunged the altcoin to a low of $0.305 on June 14th.
However, amid the improving sentiment in the crypto market, the STX price bounced back from the mentioned support and surged 47% to its current price of $0.45. Furthermore, despite a massive inflow and high volume activity on June 27th, coin buyers failed to surpass the descending trendline.
Trending Stories
This resistance trendline of this long-coming pattern reverted the price with a long-tail rejection, accentuating the high supply pressure. Thus, if the selling pressure persists, the STX price would tumble 30% and rechallenge the $0.3 support.
Anyhow, interested buyers need to wait for the pattern breakout to expect a genuine rally.
advertisement
Technical indicator
RSI indicator: Similar to STX price action, the daily-RSI slope showed a considerable rally but struggled to surpass the midline(50%), indicating a lack of bullish commitment.
advertisement
EMAs: The 50-day EMA assisted sellers in reverting the altcoin from the resistance trendline. However, the traders would get additional confirmation if the coin price failed to sustain above the recently reclaimed 20-day EMA.
- Resistance levels- $0.5, and $0.63
- Support levels- $0.37 and $0.3
Share this article on:
The presented content may include the personal opinion of the author and is subject to market condition. Do your market research before investing in cryptocurrencies. The author or the publication does not hold any responsibility for your personal financial loss.


