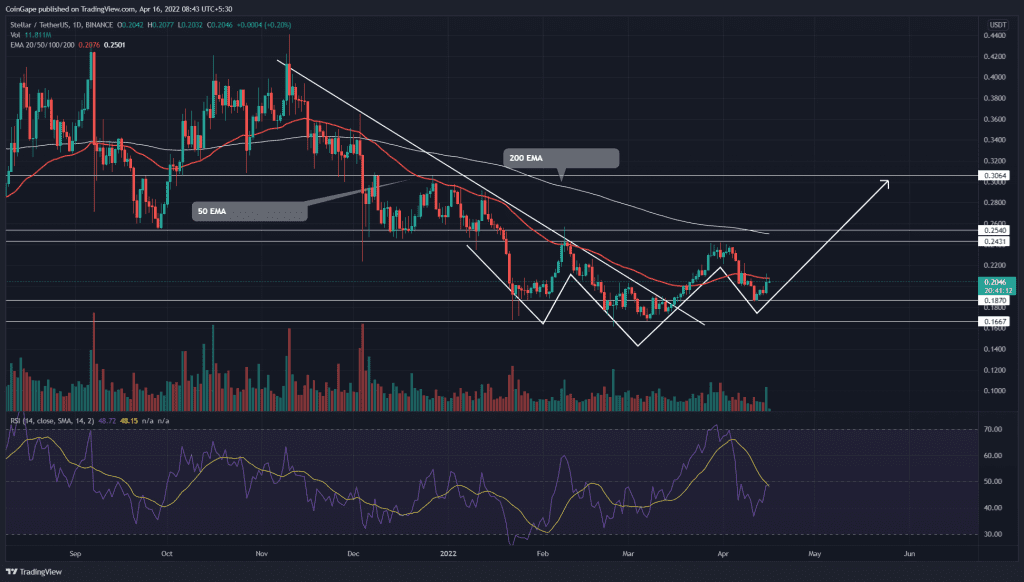
The XLM correction rally pivoted from the $0.187 support level. Under the influence of an inverted head and shoulder pattern, the buyers would drive the altcoin to an overhead ceiling of $0.24. However, the coin price may face multiple EMA barriers, which could stall the upcoming rally.
Key points:
- An upturn in 20-day EMA would offer a bullish crossover with 50-day EMA
- The XLM price forms an inverted head and shoulder pattern.
- The intraday trading volume in the XLM is $458.7 Million, indicating a 39.3% gain.
Source- Tradingview
Responding to the evident bullish RSI divergence, the XLM/USDT pair gave an upside breakout from the descending trendline on March 16th. The recovery rally soared the coin price by 34.5% and hit the overhead resistance of $0.24.
However, with the Bitcoin price dumping to the $40000 support, the XLM price turned down from the overhead resistance and discounted by 22.8%. The buyers stalled the correction rally at $0.185 and reflected a new recovery attempt which soared the coin price to $0.2.
Furthermore, the technical chart displayed an inverted head and shoulder pattern formation. Following the bullish reversal pattern, the altcoin would ascend back to the $0.24 mark.
Trending Stories
A successful breakout from this $0.24 or $0.25 resistance would trigger this pattern and plump the XLM price by another 20-25%.
Technical indicator
In a bearish sequence, the slight decline in the crucial EMAs(20, 50, 100, and 200) suggests an overall bear trend. Moreover, the 20-and-50-day EMA aligned at the $0.206 mark tries to undermine the bullish rally.
However, the RSI(38) slope reentering the bullish territory indicates a bullish sentiment in short-term
- Resistance levels- $0.21, and $0.24
- Support levels- $0.185 and $0.66


