Be[in]Crypto takes a look at the price movement for seven different cryptocurrencies, including STEPN (GMT), which reached a new all-time high price of $4.17 on April 28.
BTC
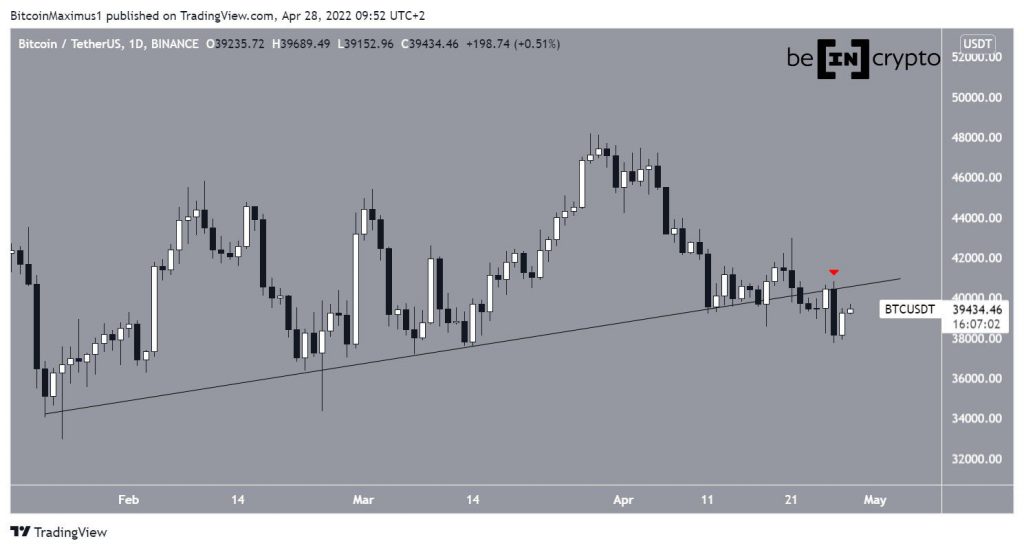
Bitcoin (BTC) had been increasing alongside an ascending support line since Jan 22. The upward movement could not be sustained and BTC broke down on April 22. Three days later, it validated the line as resistance (red icon). It has been decreasing since.
This is a bearish development that could lead to lower prices.
ETH
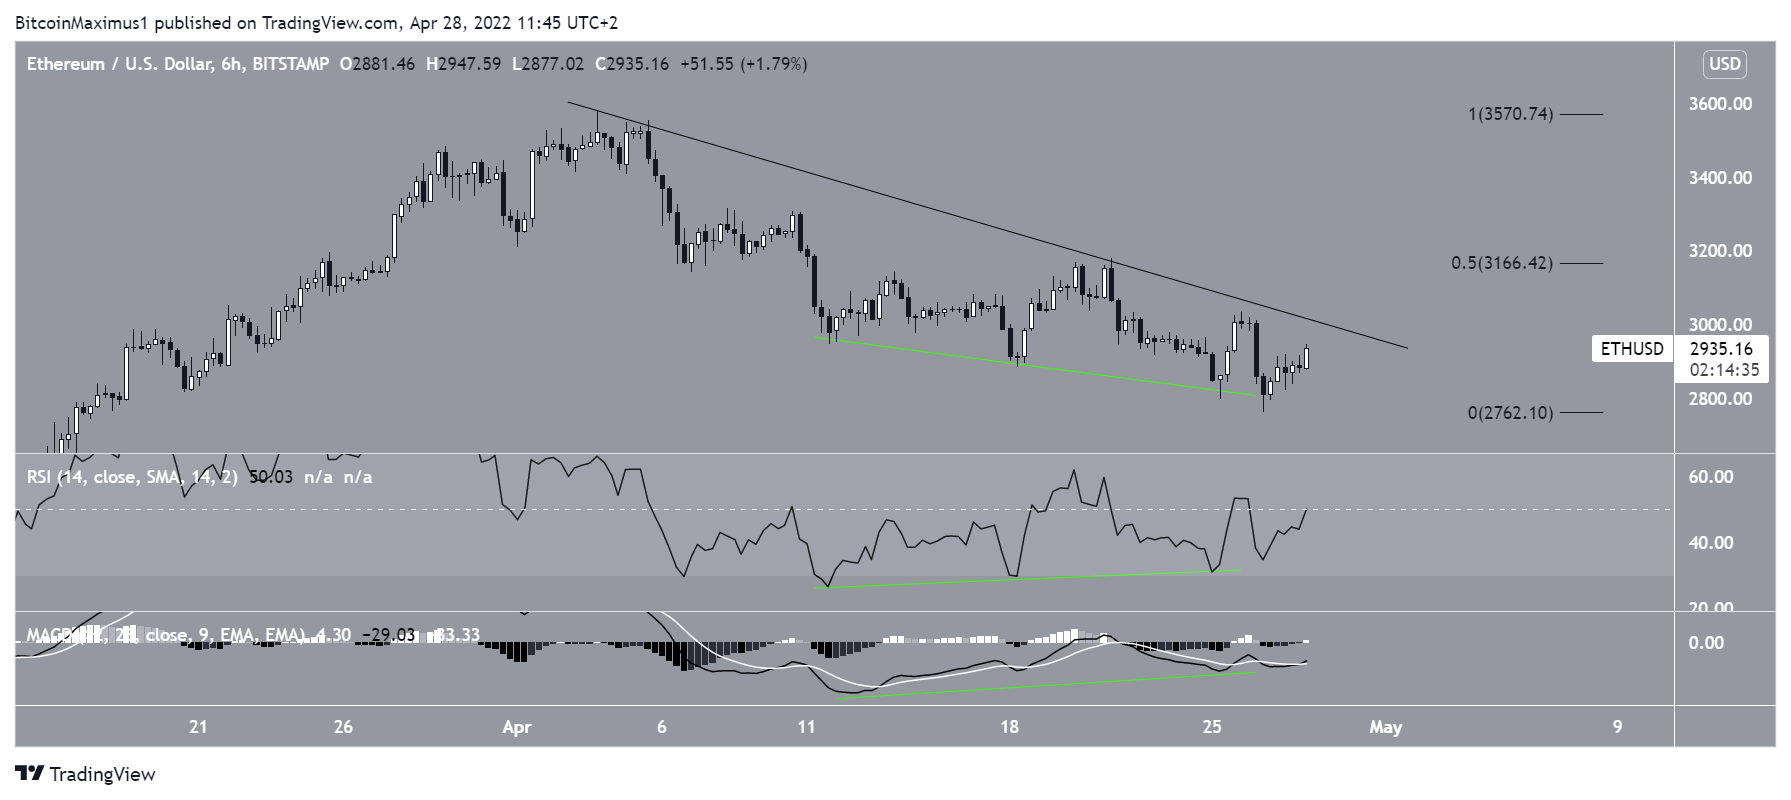
Ethereum (ETH) has been decreasing underneath a descending resistance line since April 3. The downward movement led to a low of $2,762 on April 26.
ETH has been moving upwards since. The upward movement was preceded by bullish divergence in both the RSI and MACD. Such divergences often precede bullish trend reversals. ETH is now very close to the descending resistance line.
If it manages to break out, the next closest resistance area would be at $3,170. This is the 0.5 Fib retracement resistance level and a horizontal resistance area.
XRP
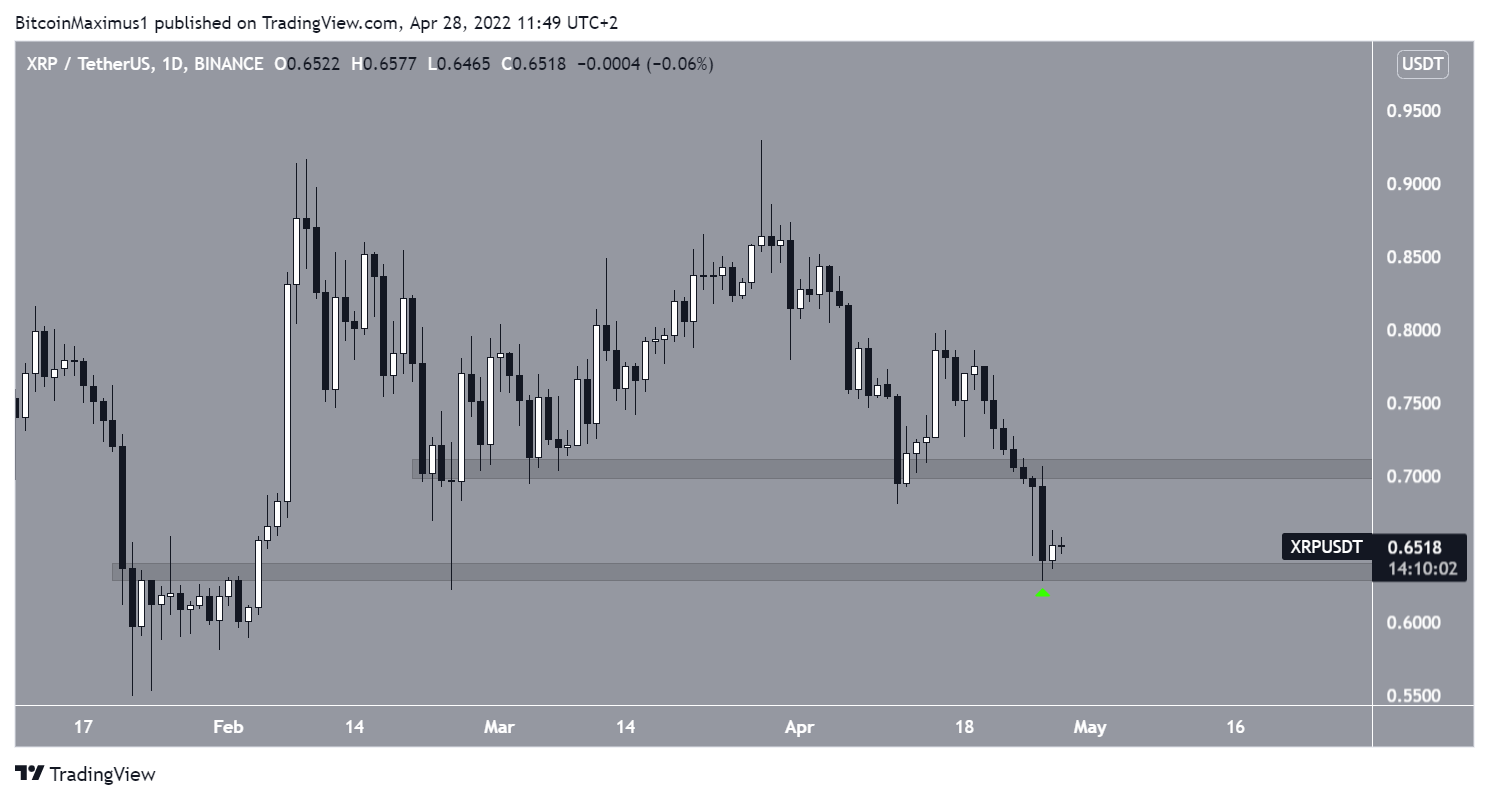
XRP has been falling since reaching a high of $0.93 on March 28. The downward movement led to a low of $0.62 on April 26. XRP bounced slightly afterwards (green icon), but has yet to initiate any type of upward movement.
If it does, the next resistance area would be at $0.705.
GMT
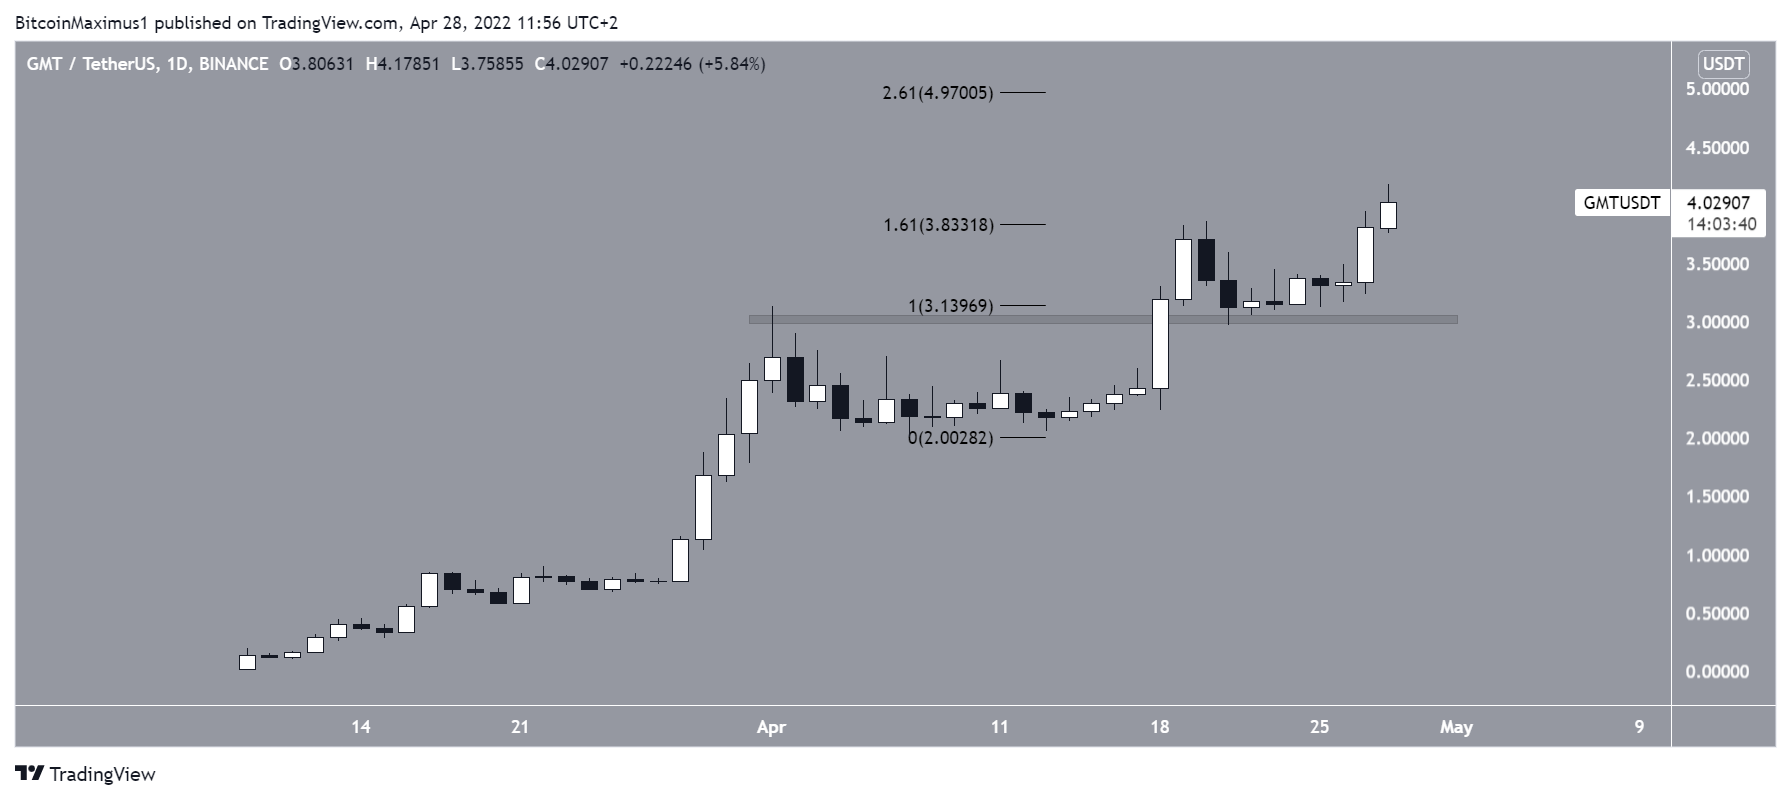
STEPN (GMT) has been moving upwards since March 7. The upward movement initially led to a high of $3.13 on April 1.
After a brief drop, GMT resumed its upward movement and proceeded to reach a new all-time high price of $4.17 on April 28. The high was made just above the 1.61 external Fib retracement resistance at $3.83.
If the price is successful in holding above it, the next resistance would be at $4.97. This is the 2.61 external Fib retracement resistance level.
MATIC
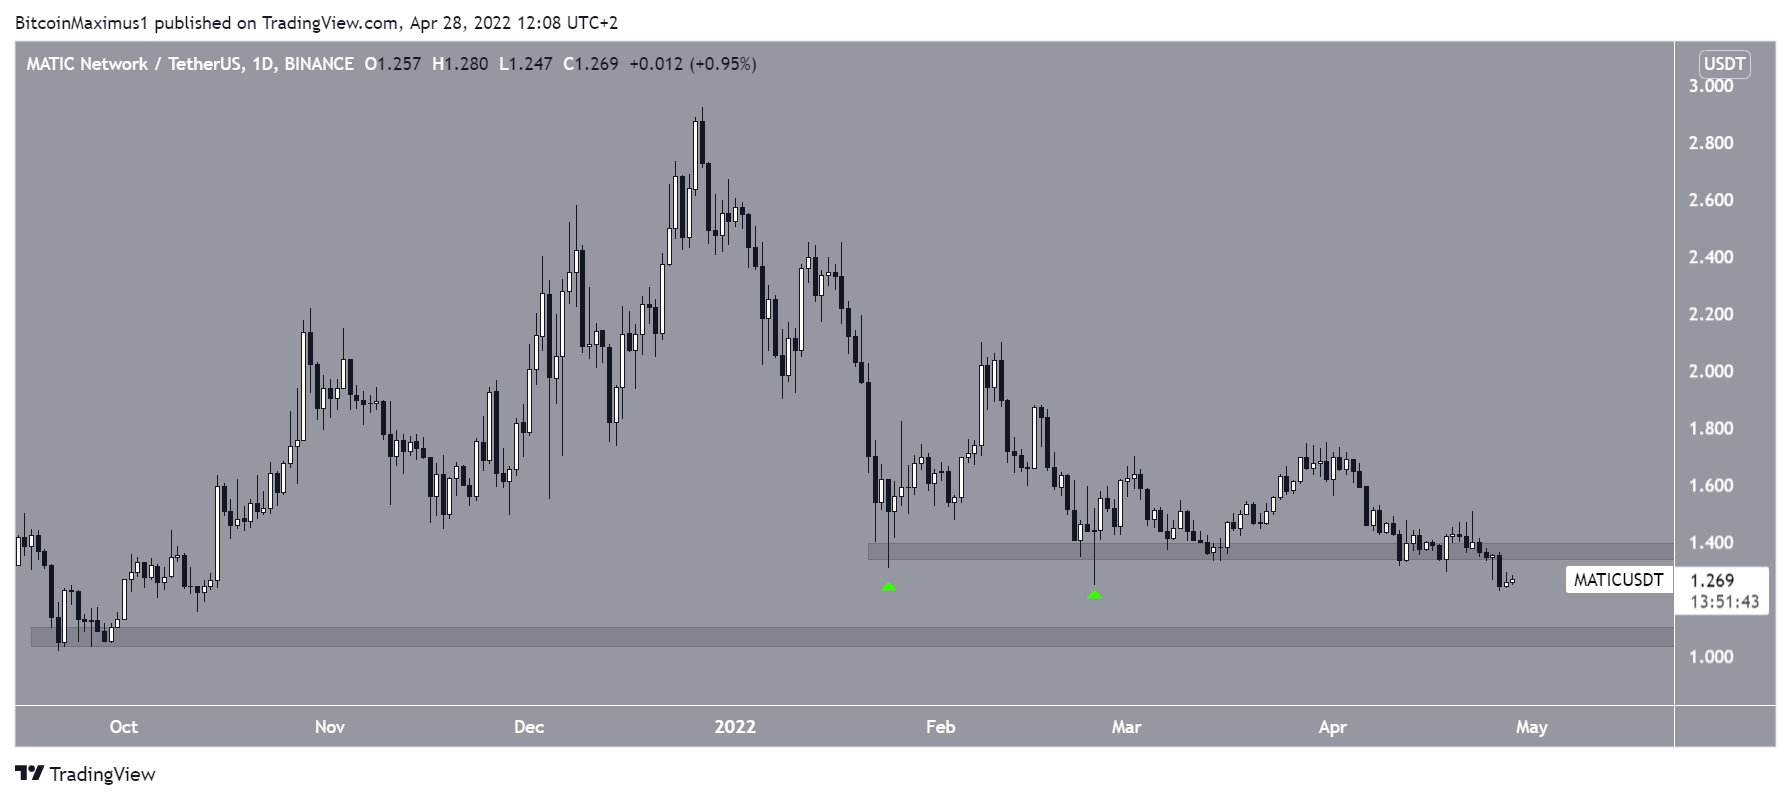
Polygon (MATIC) has been falling since reaching a high of $2.97 on Dec 27.
Initially, it bounced above the $1.37 horizontal area, creating two long lower wicks in the process (green icons).
However, MATIC broke down on April 25.
If the downward movement continues, the next closest support area would be at $1.05.
GRT
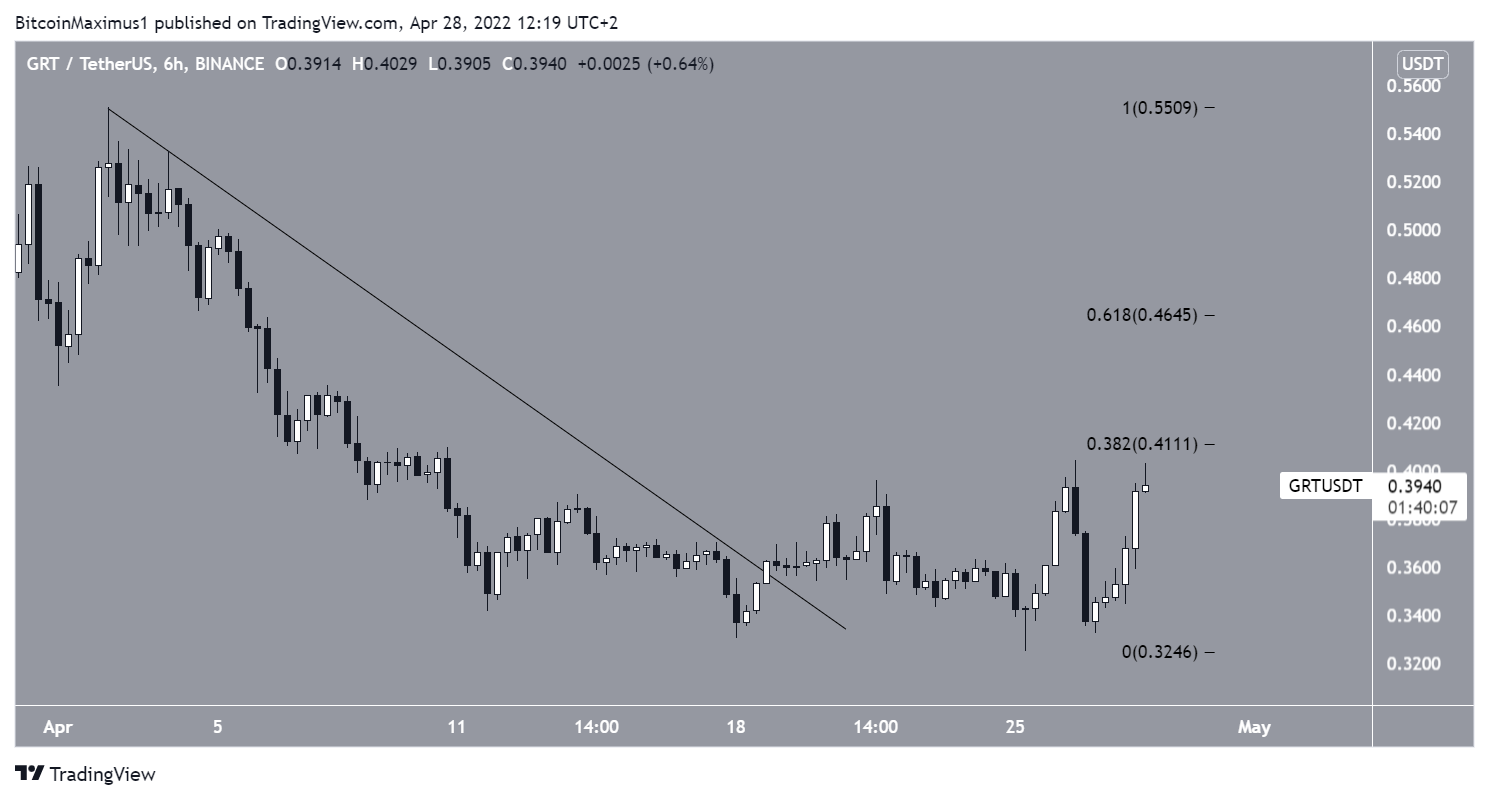
The Graph (GRT) had been decreasing underneath a descending resistance line since April 2. The downward movement led to a low of $0.33 on April 18.
GRT bounced afterward and broke out from the resistance line the next day. Currently, it is attempting to move above the $0.41 resistance, which is the 0.382 Fib retracement resistance level.
If it manages to move above the $0.41 resistance area, the next resistance would be at $0.465.
APE
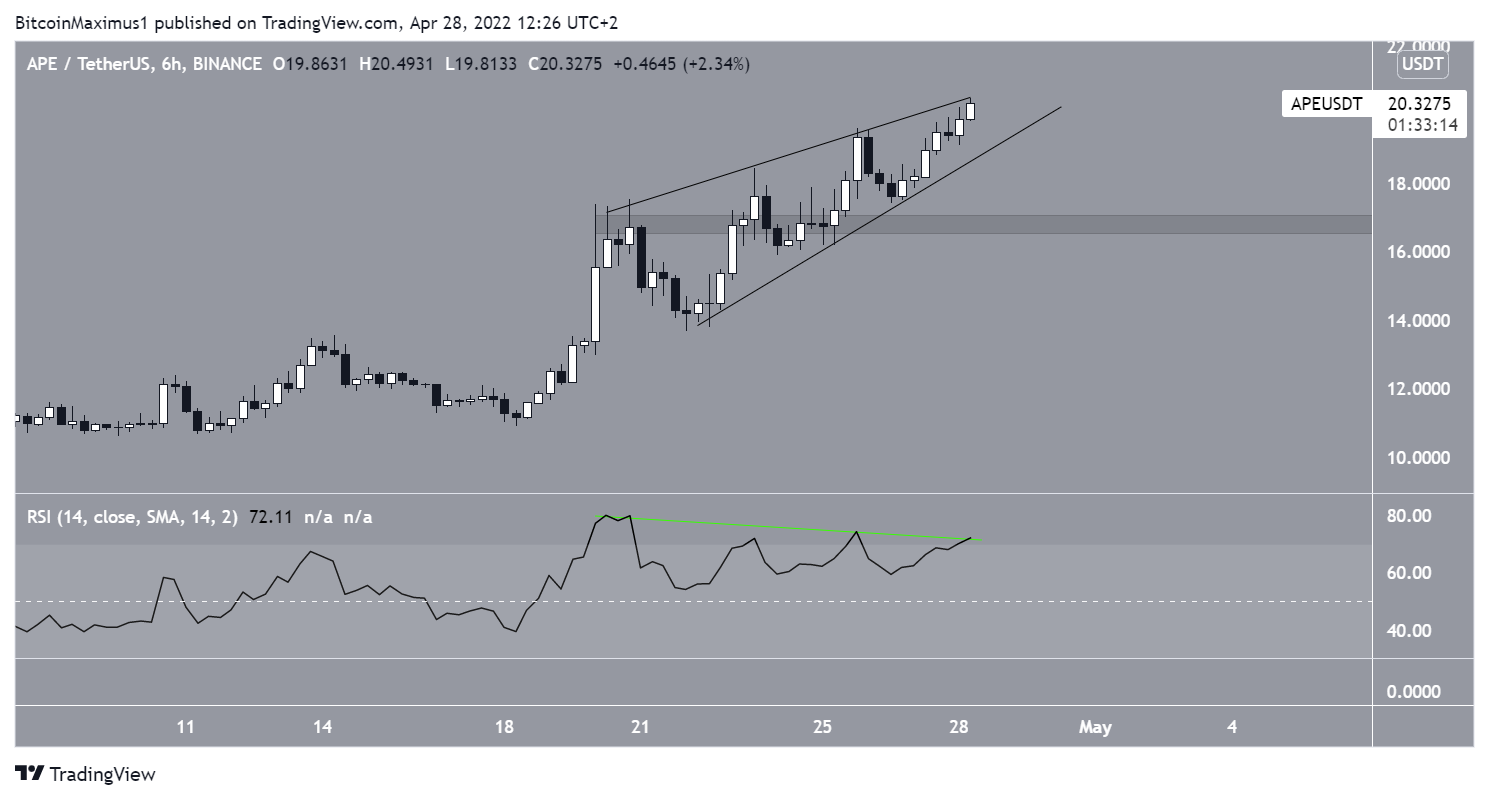
ApeCoin (APE) has been increasing at an accelerated rate since April 18. From April 20, the increase has been contained inside an ascending wedge, which is considered a bearish pattern.
When combined with the bearish divergences in the RSI, it is possible that APE will break down from the wedge. In that case, the closest support would be at $16.80.
For Be[in]Crypto’s latest Bitcoin (BTC) analysis, click here
Disclaimer
All the information contained on our website is published in good faith and for general information purposes only. Any action the reader takes upon the information found on our website is strictly at their own risk.

