The opening of the trading week had seen bitcoin surge again and had touched as high as $32,000, albeit briefly. This recovery had taken the market by surprise given that indicators were pointing toward more bearish trends. Nevertheless, the recovery was a welcome sight as it put bitcoin on a track to end its red streak. The reason behind this rally remains shrouded in mystery, however, but open interest may provide an answer.
Was It A Short Squeeze?
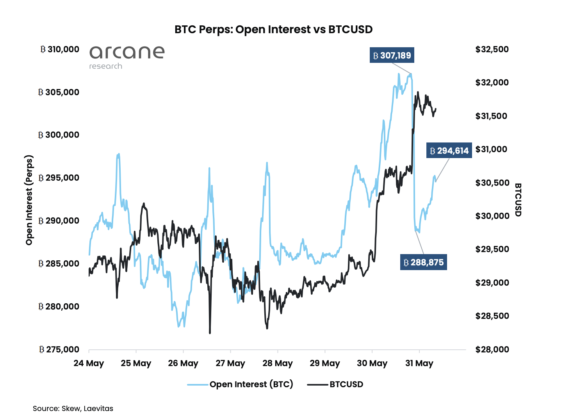
The global open interest had seen a surge towards the end of last week and this has been even more prominent in the bitcoin open interest. The surge had sent it towards a new all-time high of 307,189 BTC right before the price of the digital asset had made its incredible recovery. This would only last for long, however, given that the BTC denominated open interest would crash by a whopping 18,000 BTC in the next two hours but the impact had already been recorded.
Related Reading | Bitcoin Profitability Touches Two-Year Lows Following Market Struggles
The price of bitcoin had climbed above $31,000 after the open interest had recorded this new all-time high, suggesting that this was a short squeeze. The BTC denominated open interest was at 288,875 BTC hours later while BTC had continued on its upward trend. The two-hour period where the open interest had seen this sharp decline was especially visible on the ByBit exchange, which had recorded a 12% decline in this time period.
Surge in BTC open interest right before price breaks $31,000 | Source: Arcane Research
Following this, leverage remains extremely high, and open interest has since recovered from its decline. Its recovery was not enough to push it back to its new all-time high but it had landed at a higher low which was higher than the previous all-time high of 289,780 BTC that was recorded two weeks ago.
Bitcoin Short/Long Ration Declines
With the crash of the crypto market has come some particularly interesting implications. One of those has been a decline in the bitcoin long/short ratio that has now put it back to the level that was recorded in the first few months of 2022.
BTC struggles to hold on to $30,000 | Source: BTCUSD on TradingView.com
The long/short ratio is basically the ratio of the net long and short accounts in contract to the total accounts with open positions. The decline in this ratio has been most prominent in one of the most widely used derivative instruments in the crypto market which is the stablecoin denominated BTC perpetual.
Related Reading | Bear Market Outlook: Public Bitcoin Mining Companies And Their Profitability
The decline in this long/short ratio paints a very bearish picture as it now stands at a little over 1. This, in historical proportions, is quite low, and given that a low long/short ratio has been known to precede a large market crash, there could be more downside coming for the market. An example is the decline from bitcoin’s all-time high back in late March when the long/short ratio had reached its all-time low right before the market peaked.
Featured image from NewsBTC, charts from Arcane Research and TradingView.com
Follow Best Owie on Twitter for market insights, updates, and the occasional funny tweet…


