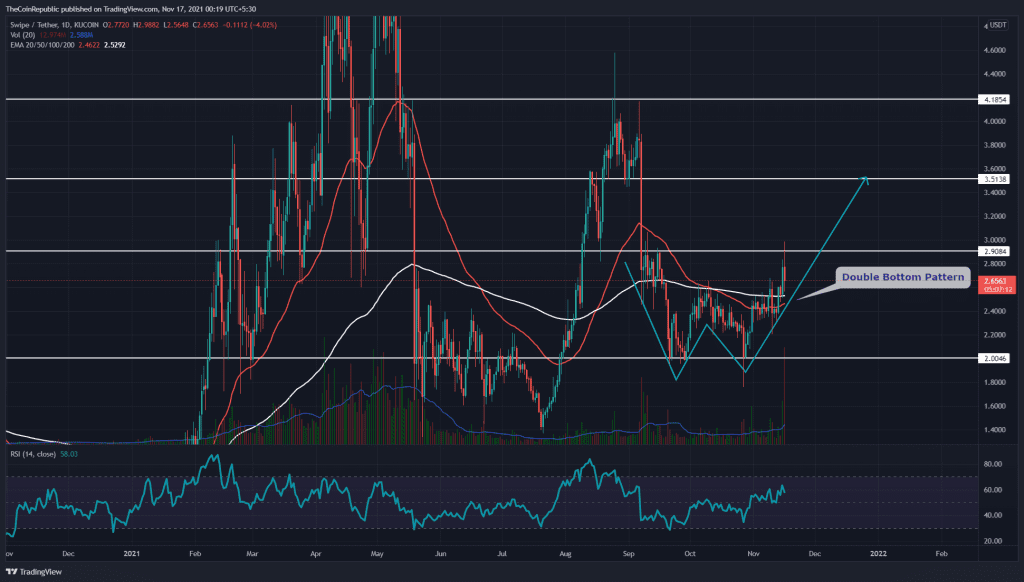
The SXP/USD chart states this token’s short-term downtrend is still intact. However, the token had started displaying some positive outlook by forming a double bottom pattern and by indicating the key technical indicators are slowly turning towards the bull’s side.
Key technical points:
- The SXP token showed a double bottom pattern in the daily time frame chart
- The SXP price gives a bullish crossover of the 20-and-50-day EMA
- The intraday trading volume in the SXP token is $827.6 Million, indicating a 156.8% hike
Source- SXP/USD chart by Tradingview
On October 28th, the SXP token price gave a second bounce from the $2 mark, confirming this level as legitimate support in this chart. Furthermore, the token price indicated a slow and steady rally which managed to reach the overhead resistance of the $2.9 mark.
The crucial EMAs(20, 50, 100, and 200) indicate a strong bullish trend for the SXP token. Moreover, the token chart also shows a bullish crossover of the 20 and 50 EMA, luring even more buyers in the token.
The Relative Strength Index value at 73 indicates a bullish sentiment for this token. Moreover, the RSI line has shown decent recovery, suggesting the bulls are growing in strength.
SXP/USD Chart In The 4-hour Time Frame

Source- SXP/USD chart by Tradingview
The SXP technical chart displayed a bullish double bottom pattern in the daily time chart. The neckline for this pattern is at the $2.9 mark, holding a long opportunity for crypto traders. The current price of the SXP token is $1.04, with an intraday gain of 17.2%.
Once the price gives a proper breakout from this resistance, the SXP traders can consider positioning their funds in this token, as the chart displays a clear target to the $3.51 mark.
.
.
.
.


