XRP fell by over 10% on Tuesday, as bearish pressure once again intensified in crypto markets. As of writing, the global cryptocurrency market capitalization was almost 5% lower, following marginal gains this morning.
Biggest gainers
The bleeding in crypto markets continued this afternoon, as such, it was difficult to find any remaining bulls due to the sea of red candles.
Relatively speaking, there were a few which managed to stand out, the most notable of them being anchor protocol.
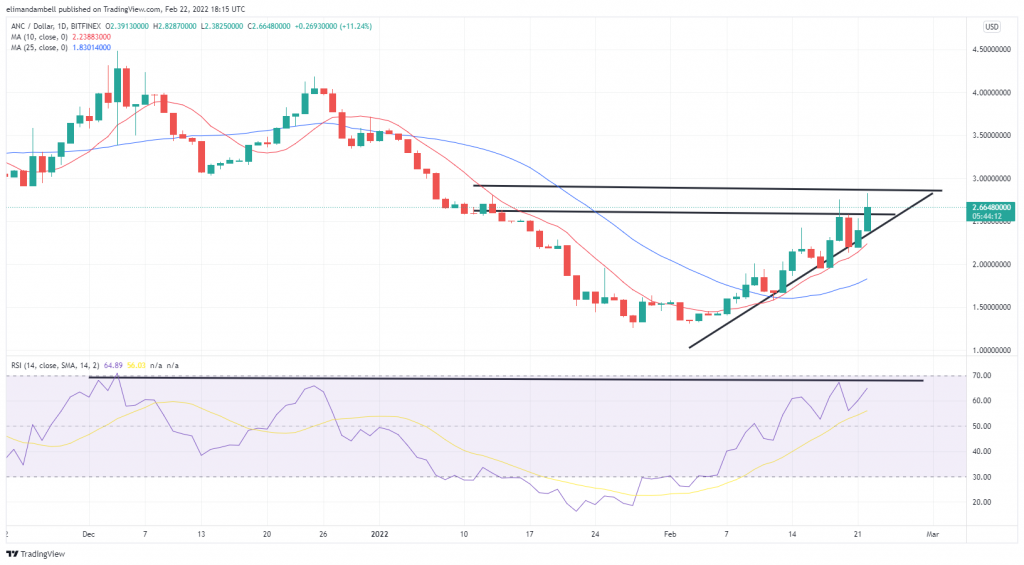
As of writing, anchor protocol (ANC) is up almost 9%, after hitting an intraday high of $2.78, which is its highest level in almost six weeks.

This move comes just as ANC/USD rallied above its resistance of $2.60, and made a move for a higher ceiling of $2.90.
Tuesday’s run also saw the 14-day Relative Strength Index (RSI) climb, and now tracks at 64, which is marginally below its own resistance level of 68.
ANC has lost some ground from earlier highs, as profit takers chose to liquidate positions, however, if the RSI moves towards 68, we may see these highs return.
Biggest losers
There were dozens upon dozens of losers in the crypto top 100 on Tuesday. As of writing, SHIB and ADA were down 7.5%, with DOT and MATIC falling between 4-6% respectively.
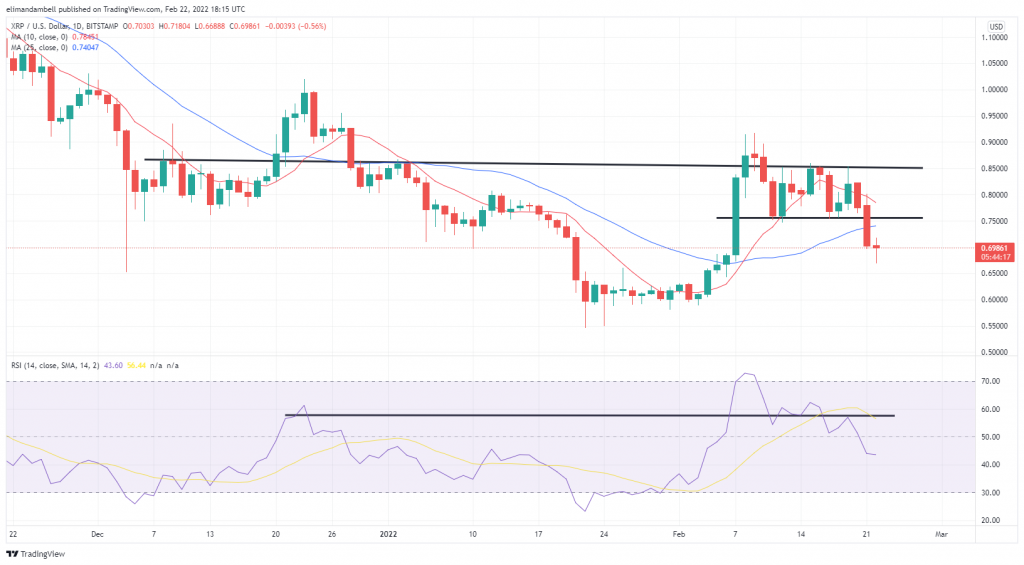
Although, the biggest to fall was XRP, which was over 10% lower during the course of the session, and 15% over the last 7 days.
XRP fell to an intraday low point of $0.6788 on Tuesday, following a high of $0.7732 to start the week.
Today’s low was its weakest since its opening candle on February 6, where it then climbed to a 1-month high of $0.8390.

Unlike three weeks ago, momentum in crypto has significantly shifted, with bearish momentum continuously picking up.
This has pushed price strength deep into oversold territory, with the 10-day, short-term moving average also showing signs of further declines.
Could a $0.6020 floor be next for XRP? Let us know your thoughts in the comments.
Image Credits: Shutterstock, Pixabay, Wiki Commons
Disclaimer: This article is for informational purposes only. It is not a direct offer or solicitation of an offer to buy or sell, or a recommendation or endorsement of any products, services, or companies. Bitcoin.com does not provide investment, tax, legal, or accounting advice. Neither the company nor the author is responsible, directly or indirectly, for any damage or loss caused or alleged to be caused by or in connection with the use of or reliance on any content, goods or services mentioned in this article.
Read disclaimer


