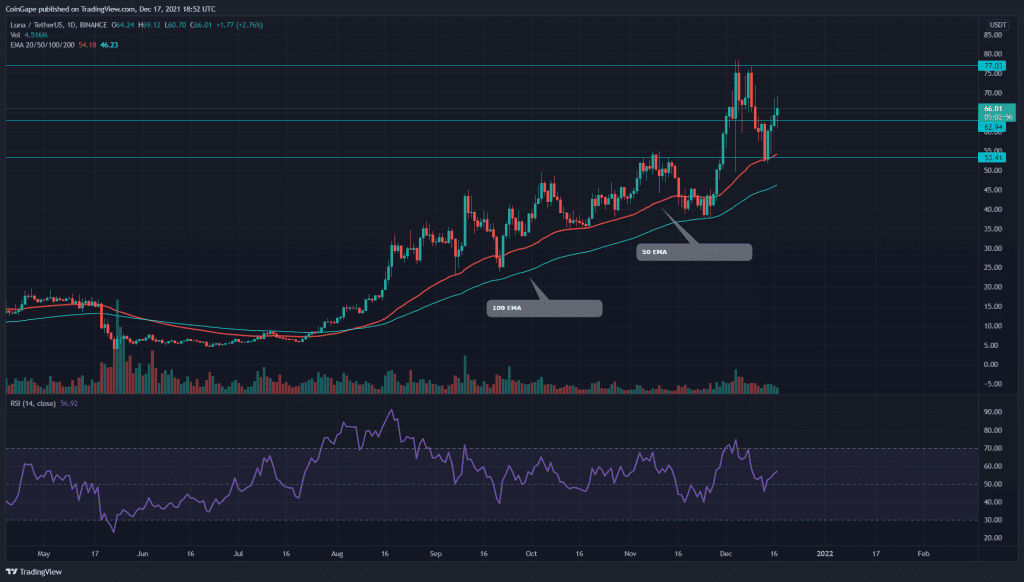
The LUNA coin shows an overall uptrend in its technical chart. The coin has recently provided another pullback opportunity for trades which took its support from the $54 mark. The coin rally is still trying to sustain above the nearest resistance of $63, supporting this emerging rally.
Key technical points:
- The coin price finds support at the 50-day EMA
- The intraday trading volume in the LUNA coin is $2.01 Billion, indicating a 0.13% loss.
Source- chart by Tradingview
The last time when we covered an article on LUNA/USD, the coin price was on the verge of retesting the $54 mark. The price obtained strong support from this level, and by displaying an inside day candle, the coin initiated a recovery phase.
The coin chart shows a steady rally with four consecutive green candles, charging towards the All-time High resistance of around $77. Despite a correction phase among most crypto coins, the coin flourished in those harsh situations.
The crucial EMAs (20, 50, 100, and 200) maintain a bullish alignment while the price finds support near the 50-day EMA. The daily Relative Strength Index (56) showed an impressive recovery similar to the coin’s price action.
LUNA/USD Key Levels In The Daily Chart
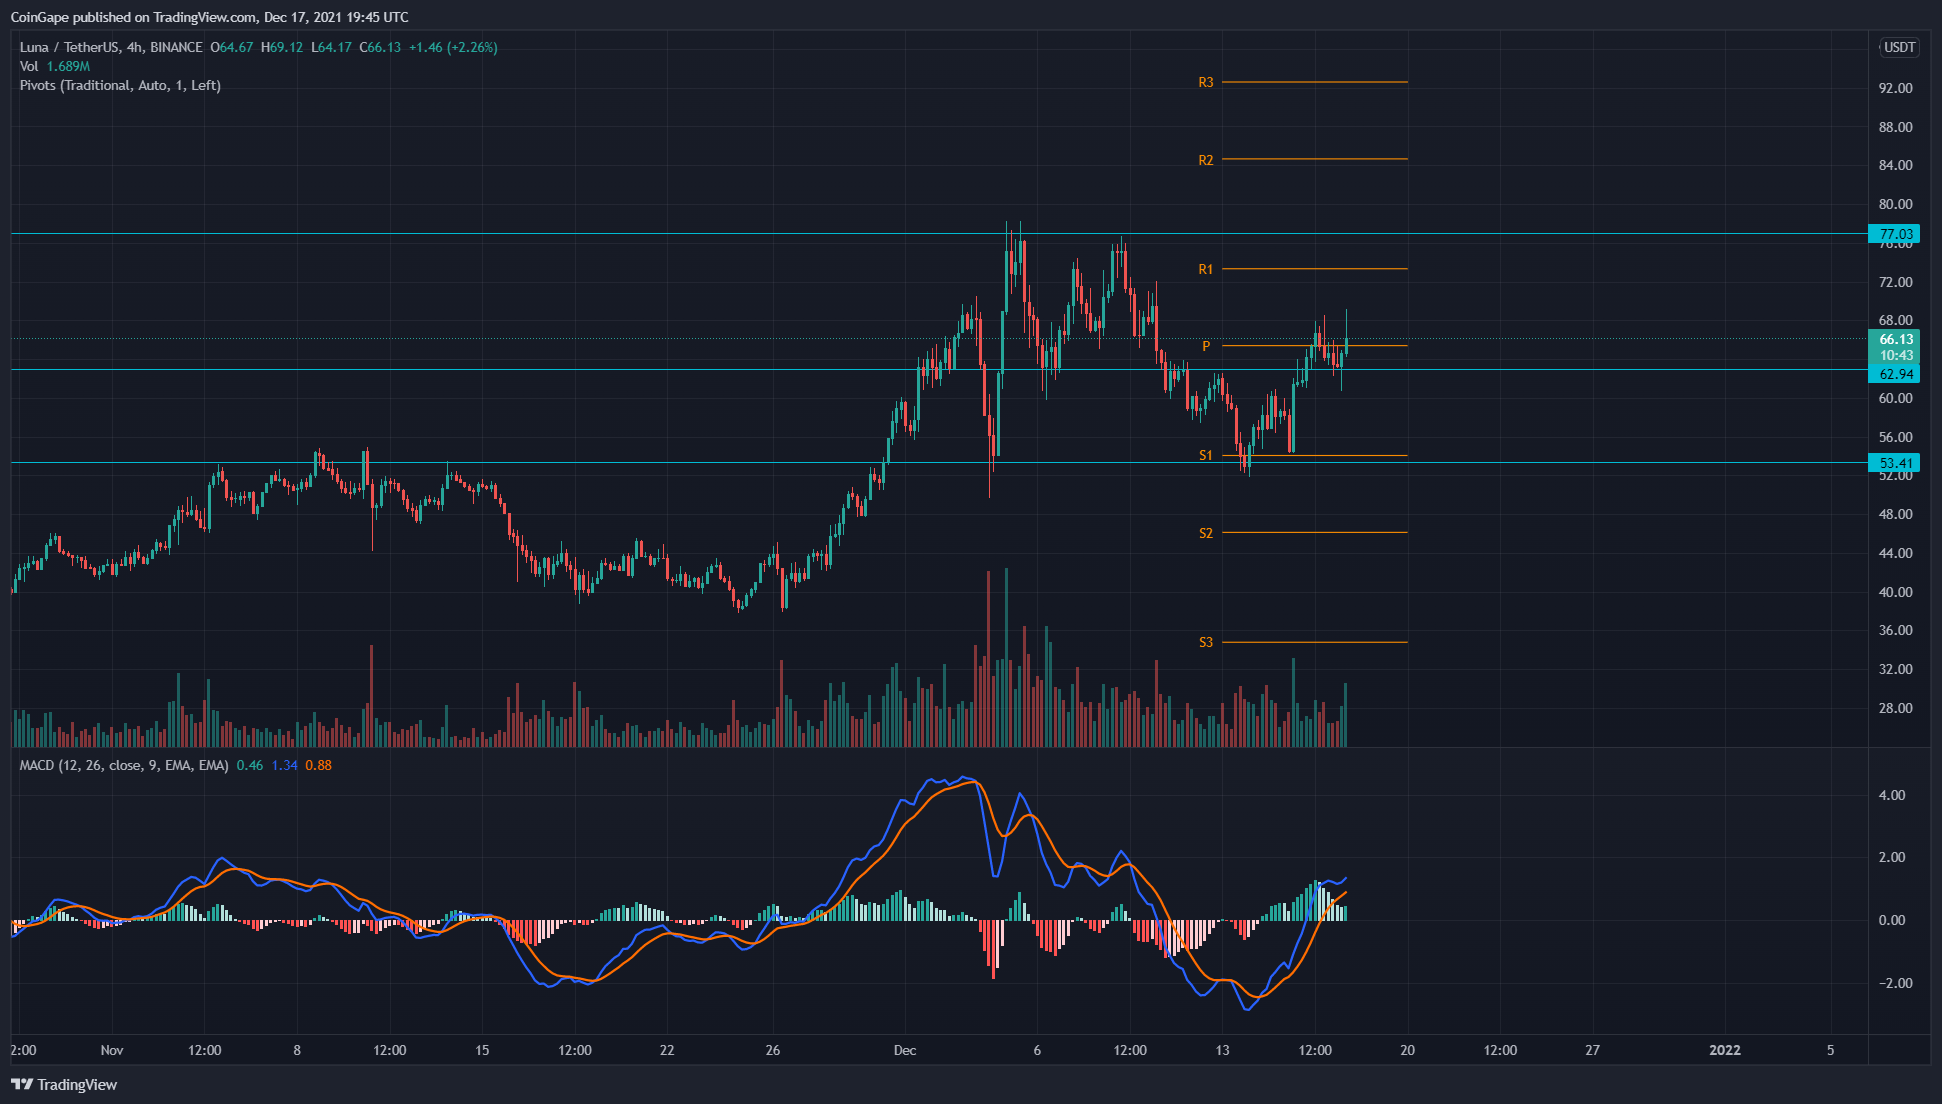
Source- SOL/USD chart by Tradingview
As for now, LUNA’s price surged 26% from $54.4 support and managed to reclaim a minor resistance level at $63. The coin is trying to sustain above this level which would help this rally to retest the overheads resistance of $77.
As for the key resistance levels, the coin traders can expect the $77 and $85 to play an important role. In contrast, the support levels are $63 and $53 marks.


