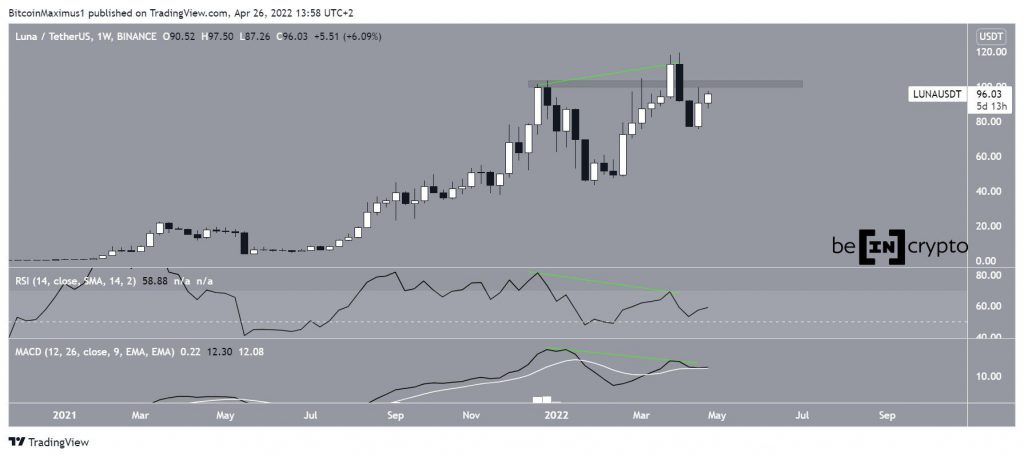
After initially deviating above the $102 area, Terra (LUNA) has fallen back below it and is potentially validating it as resistance once more.
Terra (LUNA) has been decreasing since reaching an all-time high of $119.55 on April 5. The descent led to a low of $75.67 on April 18. The price has been increasing since. The all-time high and ensuing drop, creating a bearish deviation above the $102 area. After the breakout, LUNA was expected to validate the $102 area as support.
However, instead of doing so, LUNA fell through the area, which is now expected to provide resistance once more.
Additionally, the decrease was preceded by bearish divergences in both the RSI and MACD (green lines). Such divergences often precede significant bearish trend reversals. The fact that they are transpiring in the weekly time frame increases their significance and suggests that a top might have been reached.
Short-term movement
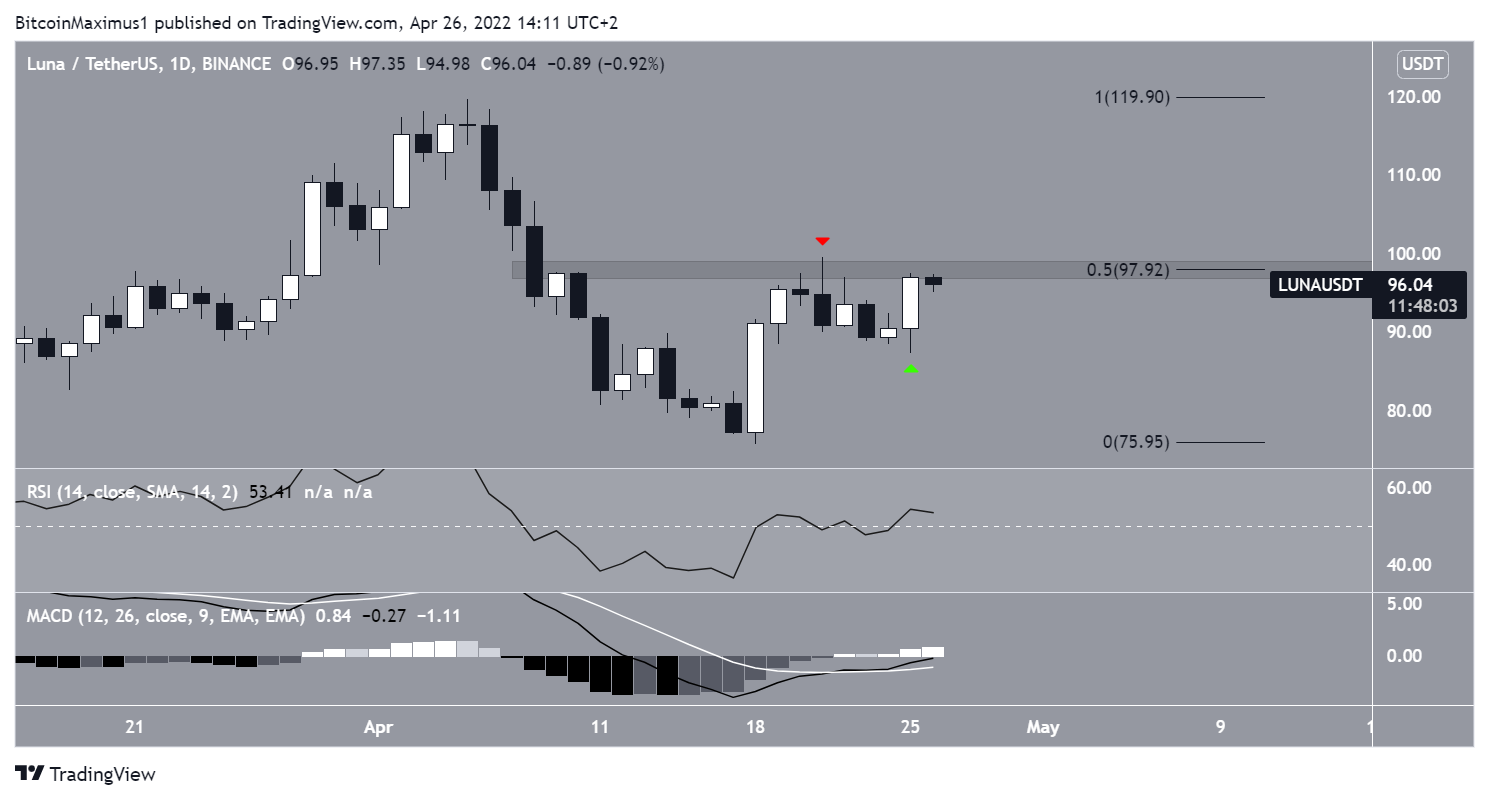
The daily time frame reiterates the importance of the $102 resistance area, since it shows a strong resistance at $98, created by both the 0.5 Fib retracement resistance level and a horizontal resistance area. In light of this, the entire $98 – $102 area is considered strong resistance.
However, both the price action and indicator readings provide conflicting signs. On April 21, LUNA created a bearish hammer candlestick (red icon). The candlestick was created inside the $98 resistance area.
After a brief drop, the price created a bullish candlestick on April 25.
The RSI and MACD both provide mixed readings. While both indicators are increasing, neither has a sharply upward moving slope, which would be a sign that momentum is increasing. Furthermore, the MACD is not yet positive, even though the RSI is above 50.
While these can be considered bullish signs, they are not nearly sufficient to negate the bearishness from the weekly time frame.
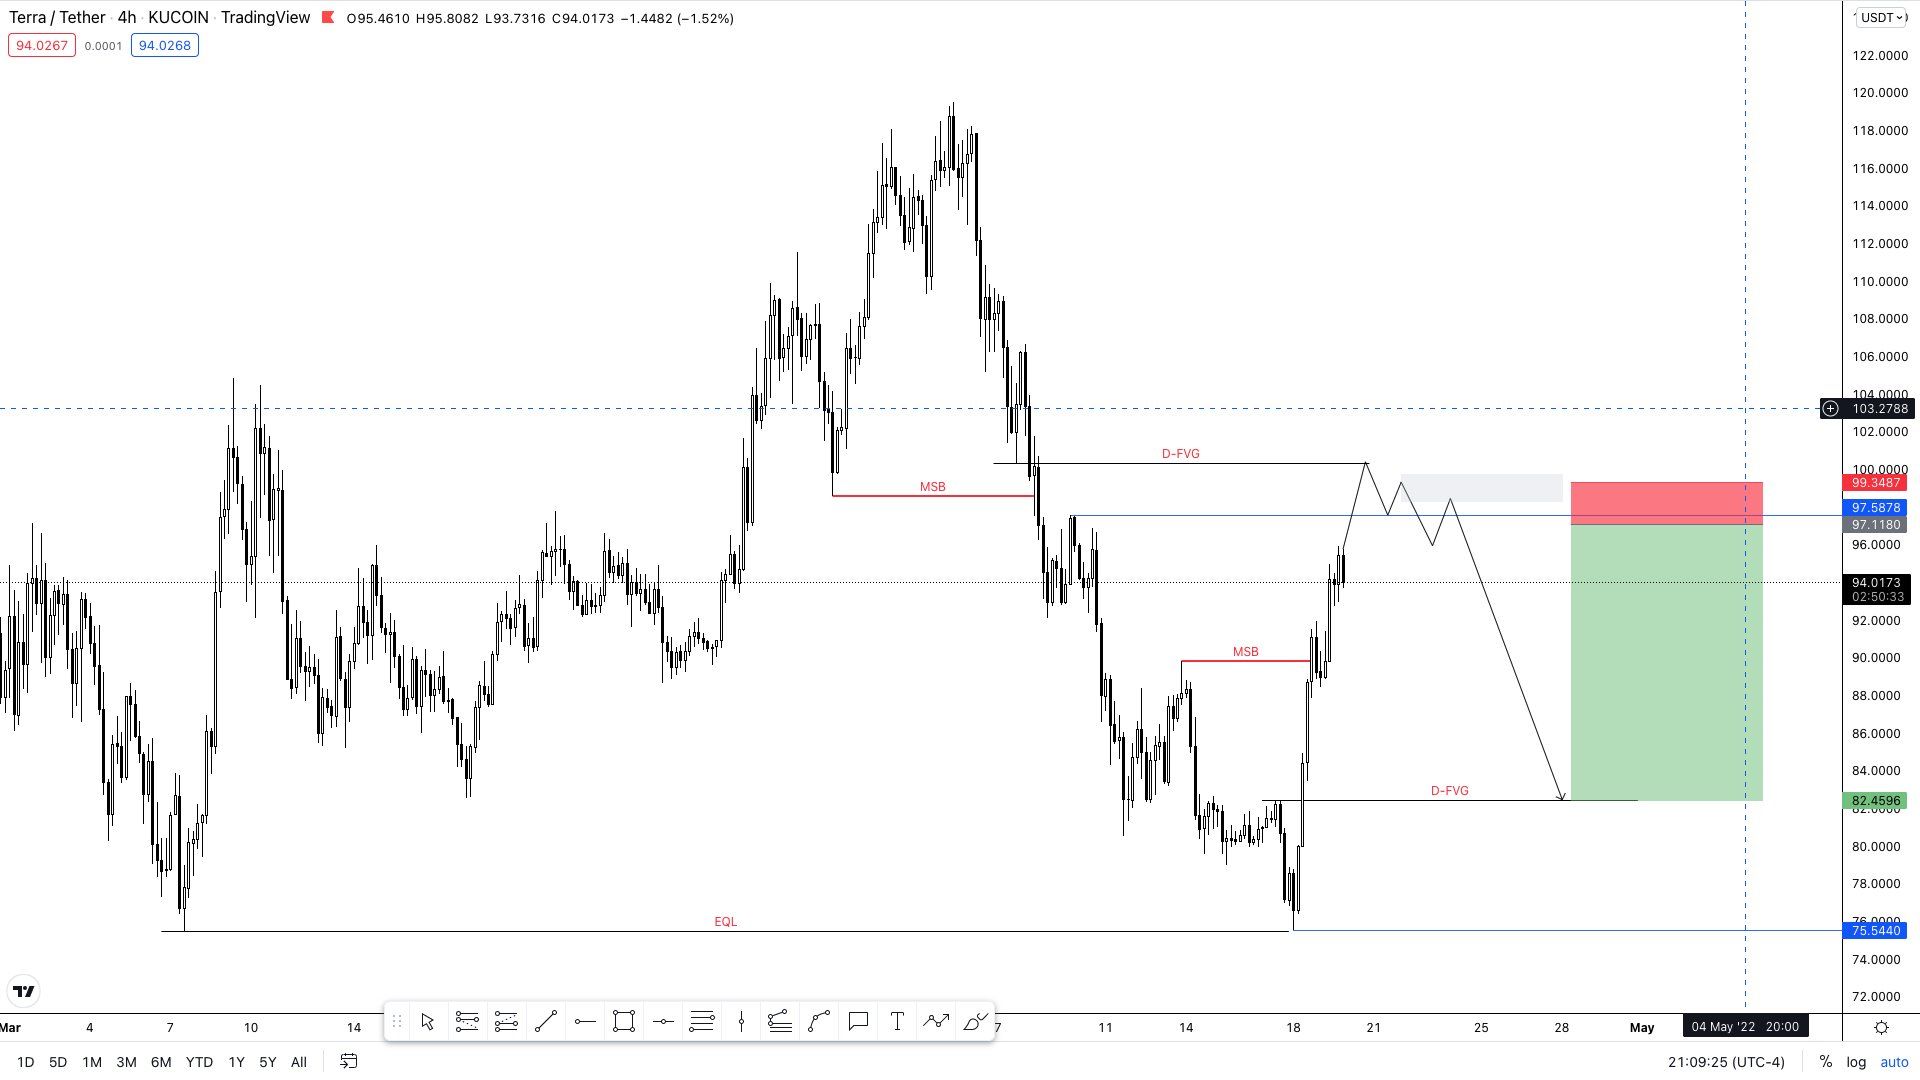
Cryptocurrency trader @The_sci tweeted a chart of LUNA, stating that the price is expected to decrease towards $80.
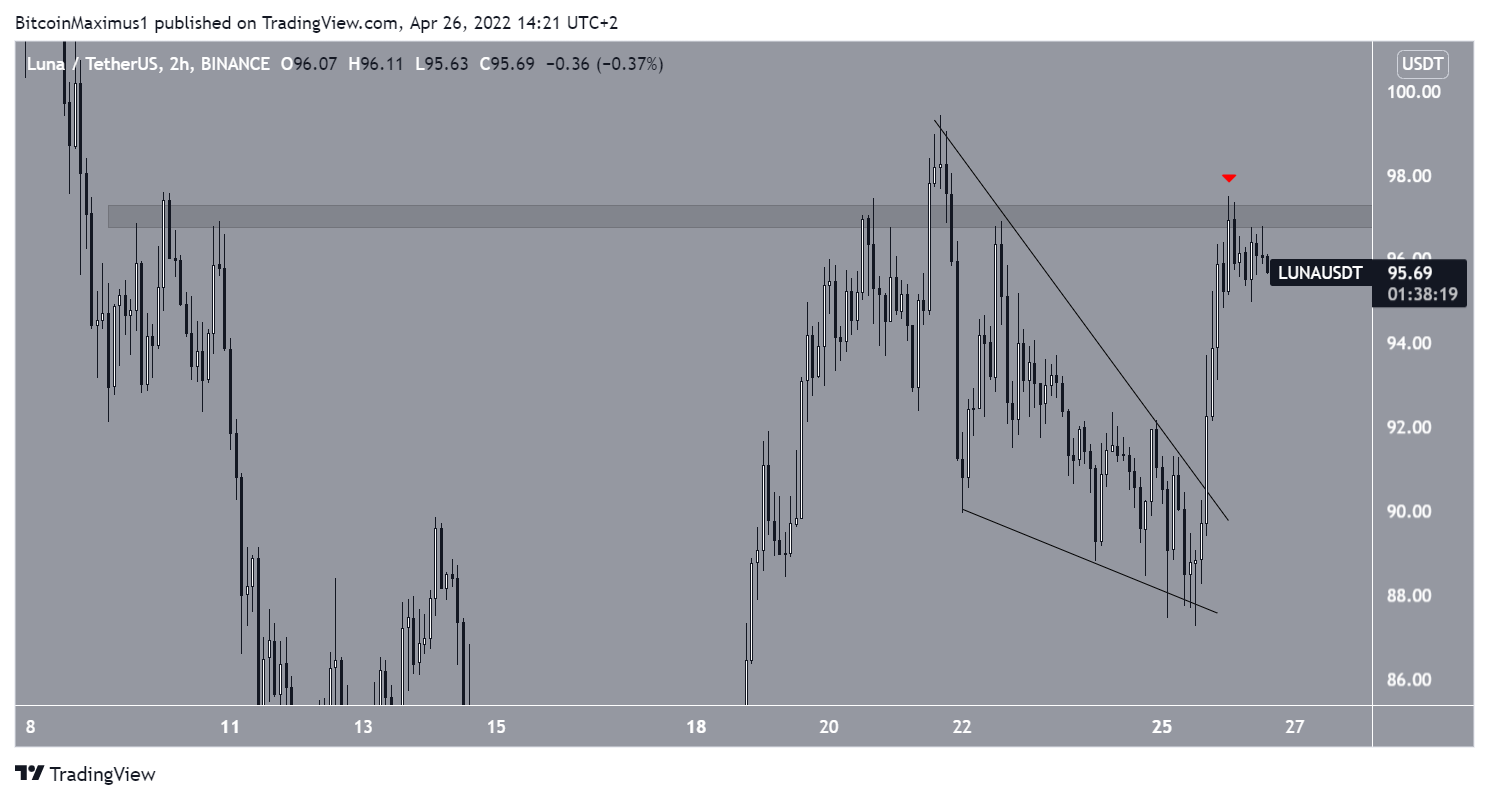
On April 25, LUNA broke out from a short-term descending wedge, initiating the current upward movement. However, as outlined above, it failed to move above the $98 area and was rejected by it instead (red icon).
If LUNA fails to reclaim this area, it would be expected to fall towards $80.
LUNA wave count analysis
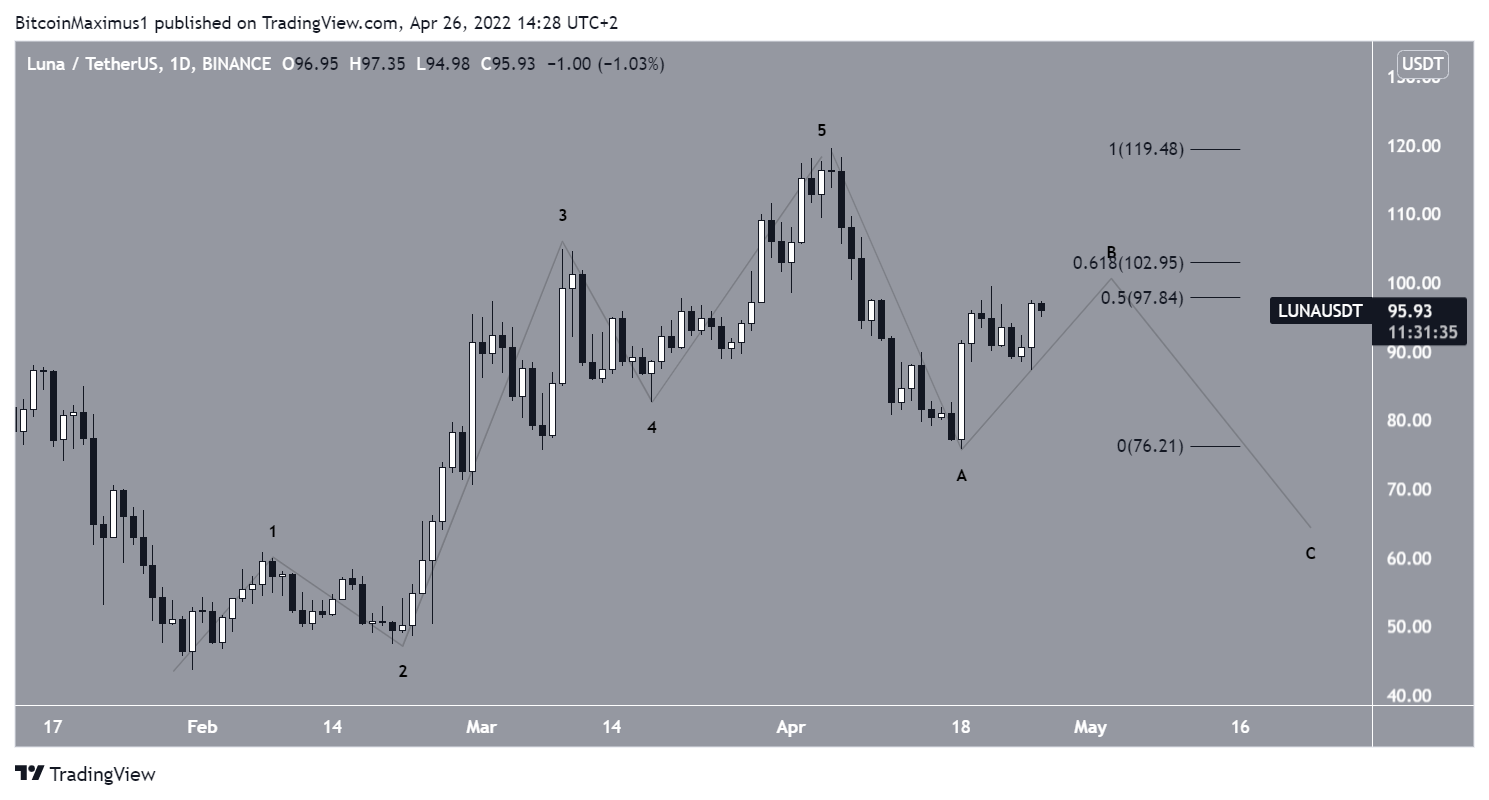
The movement from Jan. 31 to April 5 resembles a five wave upward movement. If so, the ensuing decrease is likely to be an A-B-C corrective structure. In it, LUNA seems to be in the B wave, after which another drop will follow.
The most likely area for a rejection would be between the 0.5-0.618 Fib retracement resistance level at $98-$102. Besides being an important Fib resistance, this is also a long-term resistance level, as outlined in the previous sections.
For BeInCrypto’s latest Bitcoin (BTC) analysis, click here
Disclaimer
All the information contained on our website is published in good faith and for general information purposes only. Any action the reader takes upon the information found on our website is strictly at their own risk.

