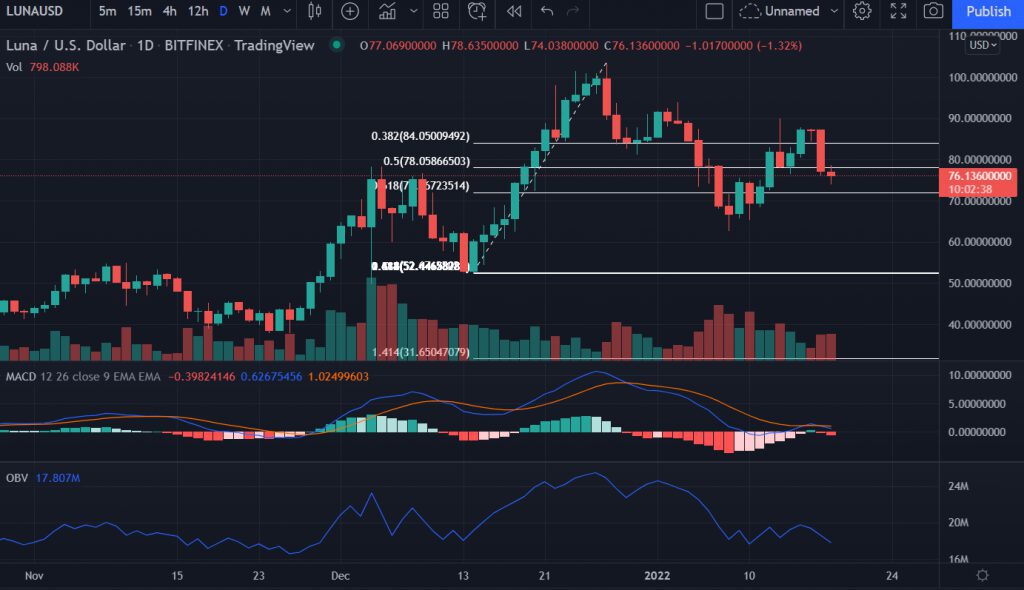
Terra’s price falls continue for three sessions after making an interim high of $90.00. The downside risk could be intensified if the weekly support of $65.28 is broken. However, the price could swing in between the range of $$72.0 and $78.0 until the market finds its equilibrium.
- Terra price downward momentum slows down in today’s session.
- Double bottom support near $62.00 pushes price into upside trajectory.
- Higher lows on the daily chart suggest an underlying bullish current in the short term.
The Fibonacci extension from the lows of December 13 placed is at $52.49 peaked at a high of $103.50, which is also the 2021 yearly highs. Then price retraced below the 50% Fibonacci retracement level at $66.80. The MACD (Moving Average Convergence Divergence) trades just above the midline with a bearish crossover signifying upcoming downside in the token’s price. The volume rises almost 50% at $2,096,055,881 in the past 24-hours day.

On the 4-hour chart, the rounding bottom near the lows of $63.00 and its breakout above the horizontal resistance level of $77.20 on January 12 sees the upside. The token price touched the high of January 16 at $87.85. However, LUNA again lost control and retested the mentioned support level. Now, the Terra price trades near a crucial level, the formation of the “hammer” candlestick pattern is being followed by a green candle. A fresh round of buying would emerge if the next candle rises above today’s session high of $80.24. Volume remains supportive for the turnaround in the price.
Talking about the support of the technical indicators, the RSI and MACD are expected to turn bullish in the coming trading sessions.
On the flip side, the failure to hold the psychological $77 level could immediately fall to the horizontal support level of $68.20. Another favoring condition for the sellers is that the price slipped below the 20-hour SMA.


