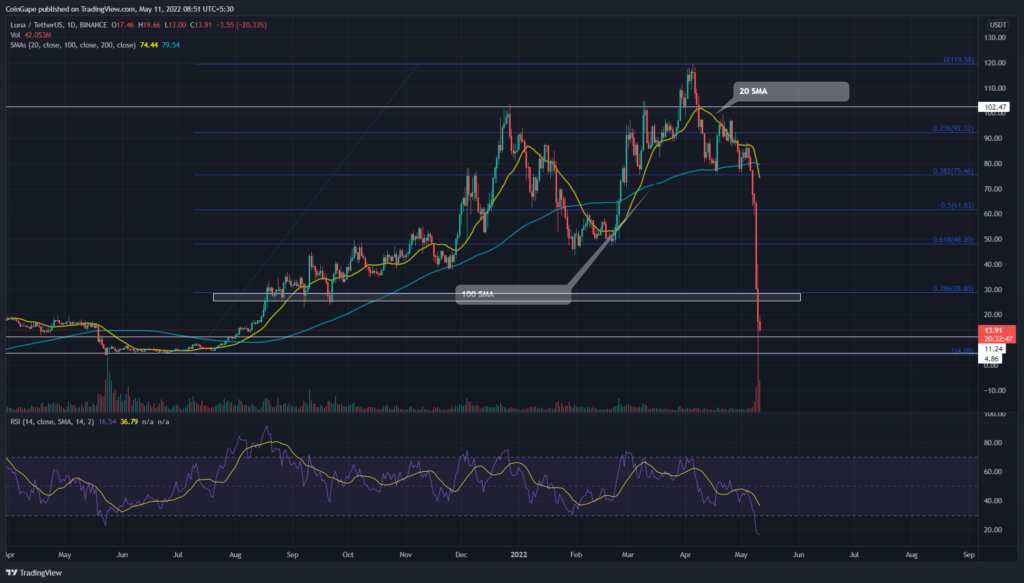
A Panic selling in Terra(LUNA) price shows a roller-coaster dip in the technical chart. Concerning the new All-Time-High of $120, the LUNA price has depreciated by 88.73% and dipped below the 0.786 FIB($30). However, such a sudden downfall is not appreciated as per technical analysis, and a minor recovery is needed to
Key points:
- The LUNA price shows seven consecutive daily-red candle
- The daily-RSI slope slumped to the oversold region
- The intraday trading volume in the LUNA is $1.13 Billion, indicating a 184.5% rise.
Source- Tradingview
The LUNA/USDT pair shows a drastic overnight fall as the overall market corrects due to the Bitcoin prices touching the $30K. However, the downfall is over-exaggerated as the Terra market value vaporizes 82% within a week.
However, while other cryptocurrencies take a bullish breather, the LUNA price continues its red march towards the lower levels. This explains the overpowered sellers fueling the bearish trend and aims to revisit the July 2021 bottom support of $5.
Yesterday, the LUNA price fell by 43% and pierced aligned support of the $30 psychological level and 0.786 Fibonacci level. The coin price may retest this breached level to bolster further correction.
Trending Stories
In the unlikely scenario of bulls regaining trend control, the buyers would turn the retest candle into a fakeout one. If they succeed, the altcoin may witness a minor recovery to $50
- Resistance levels: $1 and $1.18
- Support levels: $0.67 and $0.47
Technical indicator
RSI Indicator: the daily RSI drops into the oversold region, accentuating the market’s overextended selling. This discounted price could attract additional buyers, supporting the reversal theory.
EMA: the sudden price drop has left daily-SMAs(20, 50, 100, and 200) far behind the road. However, a long deviation between price and moving averages isn’t healthy for a stable rally and could trigger a relief rally.


