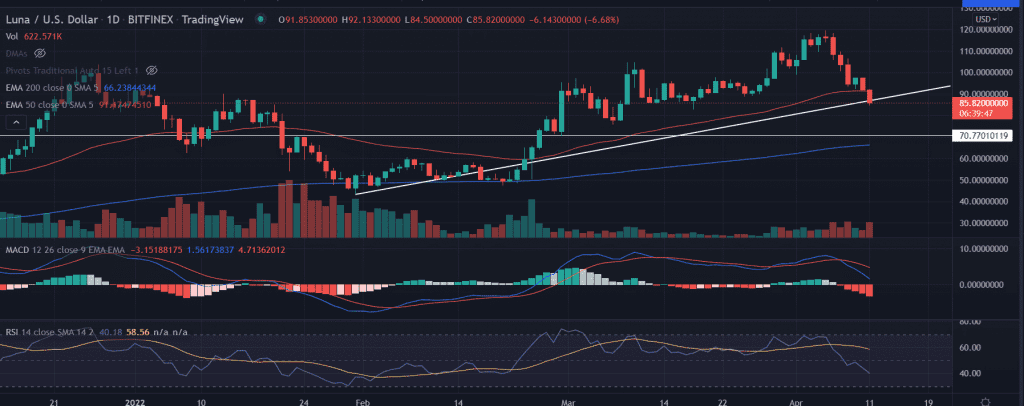
LUNA price action depicts the selling pressure over the past two days. The technical setup shows the continuation of the downtrend in the price. The formation of two red candlesticks indicates with above-average volume allowed more downside in the asset.
- LUNA price extends the slides on Monday more than 5% losses.
- More downside as the price slipped below the 50-day EMA along with the break of the ascending trend line.
- The price trades near the multiple-support level near the $85.0 level.
LUNA price reveals a sell signal
LUNA price has shed roughly 29% from the record highs of $119.44 slipped below the $90.0 demand zone. Further, the break of the ascending trend line from the lows of $43.48 could be a more compelling sign for the continuation of the downside momentum.
A daily close below the low of the session would drag the price toward the horizontal support of $70.0.
On the other hand, a spike in the buy order could reverse the prevailing downtrend as it also coincides with the breach of the crucial 50-day EMA (Exponential Moving Average) at $91.20.
On moving higher, an immediate upside target would be captured at the psychological $100.0 level.
Next, market participants could bounce back to the swing highs of $119.44.
LUNA price surged nearly 176% from the lows seen in late January. However, the LUNA buyers failed to sustain the gains beyond the April 5 highs.
As of publication time, LUNA/USD holds at $86.49, down 5.95% for the day.
Technical indicators:
RSI: The daily Relative Strength Index slipped below the average line on April 5. The price approaches the oversold zone.
MACD: The Moving Average Convergence Divergence oscillated above the mid line with the bearish bias.


