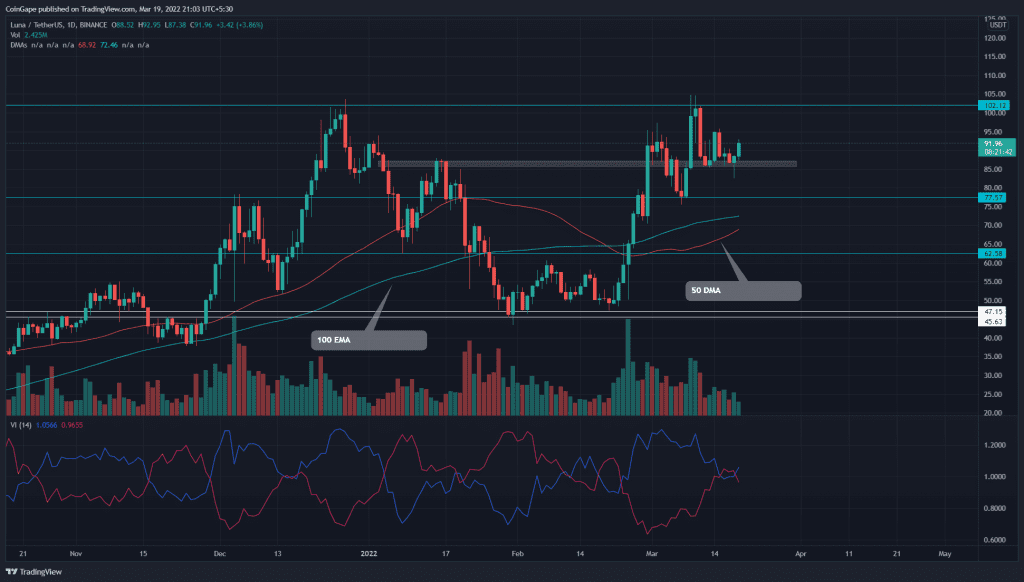
The minor correction devalued the LUNA/USDT pair by 15%, reaching the $86 mark. The buyers sustained above this new flipped support and tried to bounce back with a double bottom pattern. The bullish pattern could drive the altcoin by 11% and rechallenge the 100 resistance.
Key points:
- The long-tail rejection candle at the $86.6 level suggests it as valid support.
- The 50-and-100 DMA is nearing a bullish crossover in the daily time frame chart
- The intraday trading volume in the LUNA is $2.59 Billion, indicating a 19.65% loss.
Source- Tradingview
On March 10th, the Terra(LUNA) price retested the All-Time High resistance of the $100 mark. The higher price rejection candle at this level indicated an upcoming pullback, which plunged the altcoin to $86.5 support.
On Friday, the hammer candle(long-tail candle) suggests the buyers got a good foothold at this local support. Today, the coin price is up by 3.65%, forming a morning star candle pattern. Moreover, this second rebound from the $86.5 hints at the formation of a double bottom pattern.
For the pattern completion, the buyers need to surge above the $100, indicating the coin is ready to reach new heights.
Contrary to the bullish thesis, if sellers pull the coin price from $100 resistance, the resulting bearish reversal would threaten a possible breakdown from the $86.5 support.
- Resistance levels: $95 and $100
- Support levels: $86.5 and $77.5
Technical indicator
DMA: The recent correction managed to hold above the $20 DMA. The rising 50-DMA could soon cross above the 100 DMA, providing an extra edge to long traders.
Vortex Indicator: A bullish crossover among the VI+ and VI- bolster the buyers to breach the $100 mark.


