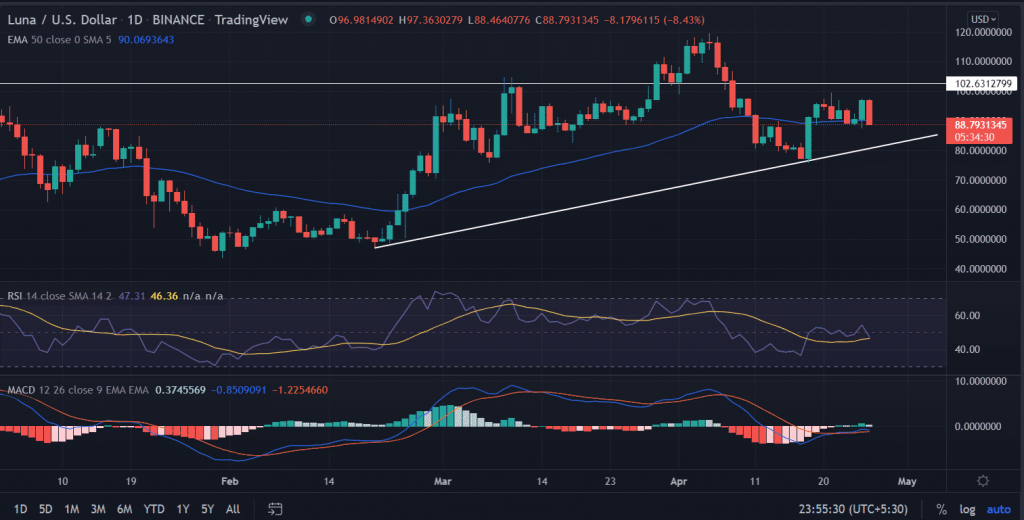
LUNA price opened the session higher with a constructive candlestick but erased all the gains as the day proceeded. The price fell like a pack of cards in a highly volatile session. However, strong support could be found near $89.0, which if broken would cast a lower spell for the asset.
- LUNA price trades lower with significant losses on Tuesday.
- A decisive break below the 50-day EMA would result in the continuation of the lower movement towards $80.0.
- A daily candlestick above $100.0 would challenge the bearish outlook on the asset.
LUNA price moves south
On the daily chart, the LUNA’s price command seems to be in the hand of bears since April 5. The price retraced nearly 35% from the record highs around $119.56 made on April 5. Further, the price slipped below the critical 50-day EMA on the way. Finally, the LUNA price rested near $77.
Since then, the LUNA buyers attempted to make a recovery way back to $100.0 but lack the strength to carry forward the gains.
Now, the token hovers near the 50-day moving average but the downside risk remains intact. A big red candlestick wiped all the previous session’s gains. This indicates the mounting selling pressure in LUNA that could test the ascending trend line near $80.
A break below the bearish sloping line would trigger another round of selling with sight on $70.
Trending Stories
On the contrary, a shift in the bullish sentiment amid a resurgence in the buying momentum could invalidate the bearish outlook. An immediate bounce toward the psychological $100 would be possible in that case.
As of press time, LUNA/USD reads at $88.88, down 8.38% for the day.
Technical indicators:
RSI: The daily relative strength index touches the average line from the higher side indicating an upside pressure in the price.
Trading volume: The 24-hour trading volume holds at $2,334,035,284 with more than a 9% loss.


