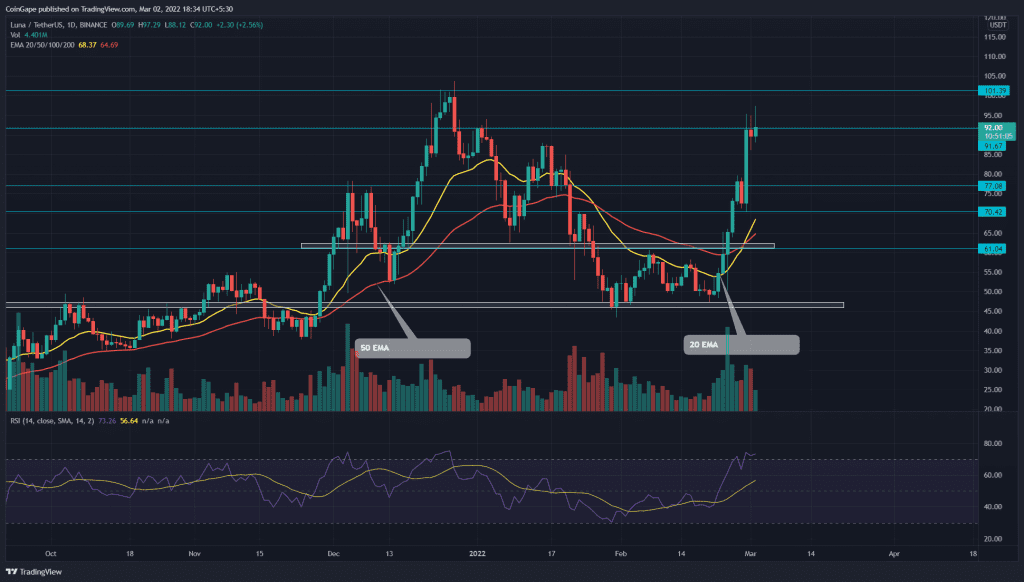
A parabolic rally has doubled the LUNA price within a week. The altcoin bounced back from the 55% retracement level($46), validating this mark as a high accumulation zone. The buyers have knocked out several resistances on their way and have reached the $93.32 mark. Can we expect LUNA to hit $100 again?
Key technical points:
- The LUNA chart shows long wick rejecting at $92 resistance
- The intraday trading volume in the LUNA is $4.6 Billion, indicating a 19.9% loss.
Source- Tradingview
On February 24th, the LUNA price breached the $60 psychological level, providing the first sign for recovery. The buying pressure gradually increased and breached the two significant resistance levels of $70 and $81.
In light of the uncertainty in the crypto market caused by Russia and Ukraine’s negotiations, the LUNA price was among the top gainers last week. Concerning the Feb 28th high, the coin chart displayed a 100% gain from the $46 support.
However, the higher price rejection candle at $92 resistance indicates the buyers are struggling to overcome this level, which could demand a minor pullback before the bullish rally could resume. The expected pullback can find support near the $81 or $72.
Currently, the LUNA price is trading at $91, with an intraday gain of 1.46%
- Resistance levels: $48.6 and $60
- Support levels: $45.6 and $45
Technical indicator
The recent jump has surged the LUNA price above the .20, 50, and 100-day EMs, indicating the buyers have obtained additional support on their side. Moreover, a bullish crossover of the 20 EMA from the 50 and 100 could accelerate the ongoing rally.
The Relative Strength Index(73) slope spiked into the bullish territory, indicating a positive shift in the traders’ sentiment.


