The market-wide rally has pushed multiple coins up in their charts. Terra out of the top gainers propelled by almost 18%, while XRP and AAVE followed with over 8% gains in the last 24 hours.
Today’s global cryptocurrency market cap is $2.42 Trillion, with a 1.7% positive change in the last 24 hours. XRP traded for $0.95 while eyeing the dollar mark at press time. AAVE was priced at $197.04, while Terra could touch the $100 mark in the subsequent trading sessions.
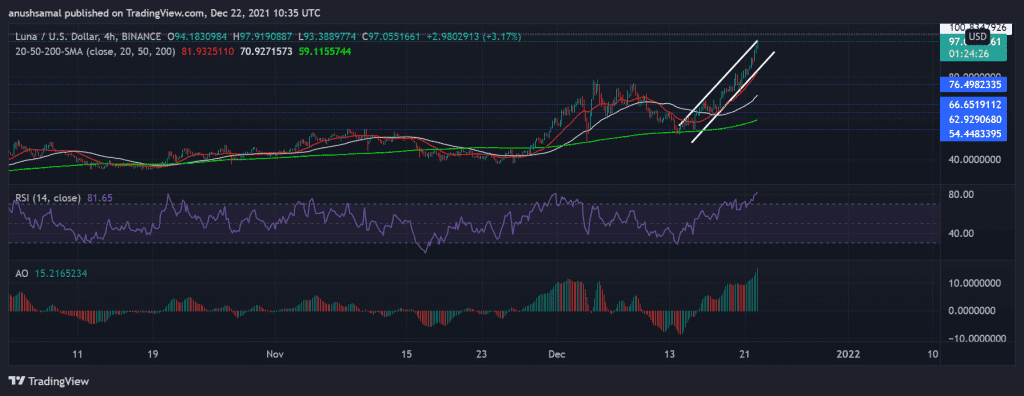
Terra/LUNA/USD Four-Hour Chart
LUNA has set out on a massive uptrend with no signs of a price correction at the time of writing. In over a week LUNA’s ROI shot up by 62.6%. Buyers have swarmed the market in anticipation of securing profits as Terra’s ascent has been quite terrific in the last week.
Near-term technicals have painted an extremely bullish outlook on Terra’s Four-Hour trading chart.
The price of Terra rested way above the 20-SMA line, a reading that confirms the positive price action tied to increased buying power in the market. Immediate resistance for the digital currency stood at $100.83 while a fall could result in Terra trading near its price floor of $76.49, marking a 22% fall in market value.
The Relative Strength Index was parked above the overbought zone. Awesome Oscillator displayed growing green histograms at press time signalling a bullish growth in prices, however, profit booking could soon drive prices down.
XRP/USD Four-Hour Chart
The month of December saw XRP lose its ground consistently. However, in the last two days, Ripple was seen undoing the losses it incurred. The altcoin could soon head for a double-digit gain as the coin was trading very close to the $1.00 mark.
This instance has pushed XRP to be overvalued and overbought, a condition the coin has witnessed a few very times in the last month and a half. It has held itself well above the immediate support level of $0.91, and its resistance point stood at $1.00. At the time of writing, XRP had broken into an upward channel price action.
The Relative Strength Index highlighted a massive jump in buying strength, while AROON preferred the bulls at press time. MACD underwent a bullish crossover and displayed green signal bars. If a bearish push managed to invalidate the current momentum, the price might immediately land up near $0.91 and then at $0.80.
AAVE/USD Four-Hour Chart
AAVE managed to sustain itself above its crucial support line of $163.19 as the coin was priced at $197.01. The token had received a sharp pullback from the 78.6% Fibonacci level, and a major resistance point for AAVE was the 50% Fibonacci level.
The buying pressure in the market was seen to be positive as the coin grew by 17% in the last week itself.
The Relative Strength Index was headed toward the overbought zone as the coin was quite overvalued at press time. On the flip side, the support level for the coin stood at $163.19. The Directional Movement Index chose to side the bulls as the +DI line was placed above the -DI line.


