Due to negative crypto market sentiment, Tether (USDT) trading volume in the first quarter of 2022 was lower than Tether trading volume in the same period of 2021.
Despite the bearish trends of the market which has seen millions of investors turn to stablecoins, investor interest in USDT remains low.
According to Be[In]Crypto research, Tether trading volume during the first quarter of the year was in the region of $5.3 trillion. This was a 46% decrease in the trading volume recorded between January and March of 2021 of around $9.9 trillion.
What led to the decline in Tether trading volume?
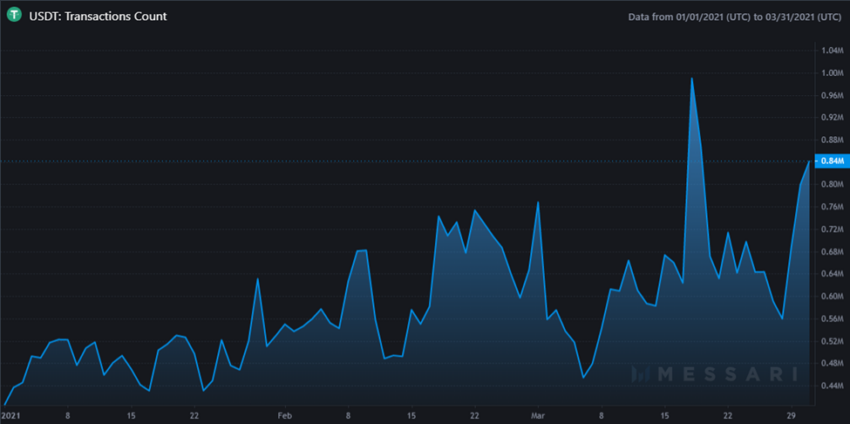
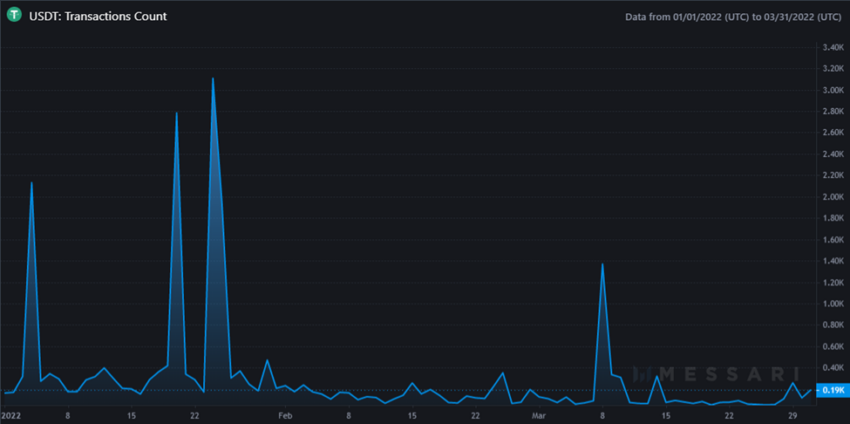
A fall in total transaction counts in the first quarter of 2022 can be attributed to as the primary reason for the sinking Tether trading volumes.
In the first quarter of 2022, the total transaction count for Tether was 26,454.
This was a 99% drop in overall USDT transaction count in the first quarter of 2021, resting at 52,459,262.

In January 2021, Tether transaction count was 15,211,685 – compared to January 2022, where its transaction count was 17,385.
In February 2021, Tether transaction count was 17,214,849 – compared to February 2022, where its transaction count was 4,266.
In March 2021, Tether transaction count was 20,032,728 – compared to March 2022, where its transaction count was 4,803.
Looking to USDT trading volume in Q1 2021 and Q1 2022
Further analyzing the impact of declining Tether transaction counts on Tether trading volume, let us consider the USDT trading volume in the Q1 2021 and Q1 2022.
In January 2021, USDT trading volume was around $3.4 trillion with a single-day high in the region of $183.6 billion – compared to January 2022 where its trading volume was approximately $1.8 trillion, and had a single-day high of $90.4 billion.
In February 2021, USDT trading volume was in the region of $3.7 trillion with a single-day high of $195.9 billion – compared to February 2022, where its trading volume was around $1.5 trillion, and had a single-day high of $107.9 billion.
In March 2021, USDT trading volume was approximately $2.7 trillion with a single-day high of $111.2 billion – compared to March 2022, where its trading volume was in the region of $1.9 trillion and had a single-day high of $90.4 billion.
Price reaction
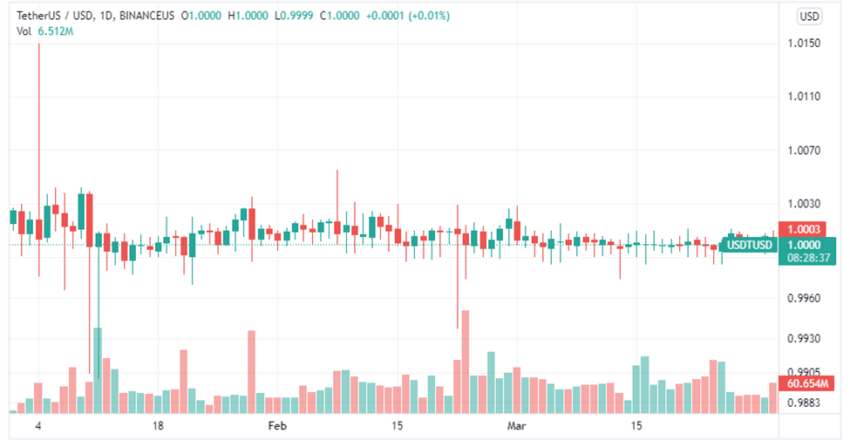
USDT opened on Jan. 1, 2022, with a trading price of $1, reaching a quarterly low of $0.9998, and closing Q1 2021 at $1.
Overall, there was no change between USDT’s opening and closing price in Q1 2022.

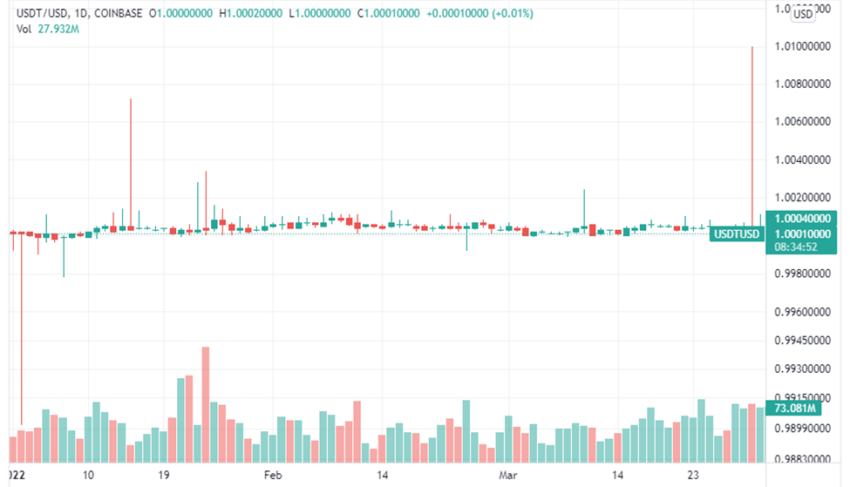
Looking to the below chart, USDT opened on Jan. 1, 2021, with a trading price of $1, reaching a quarterly low of $0.9974, and closed the first quarter of 2021 at $1.
Overall, there was no change between USDT’s opening and closing price in Q1 2021.

What do you think about this subject? Write to us and tell us!
Disclaimer
All the information contained on our website is published in good faith and for general information purposes only. Any action the reader takes upon the information found on our website is strictly at their own risk.


