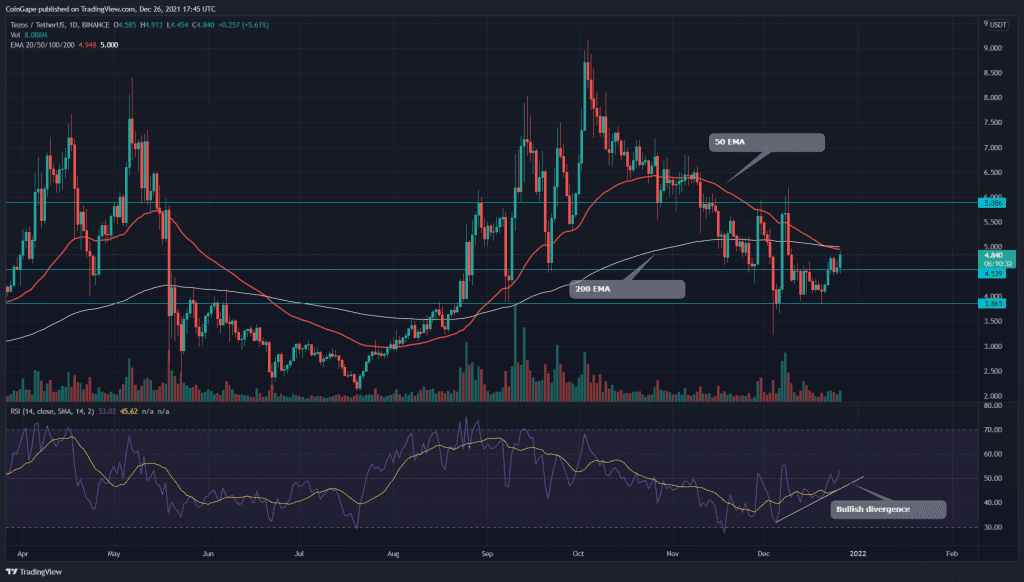
The Tezos price maintains a short-term downtrend in its technical chart. This pair plummeted to the $3.85 support, bringing a 58% discount in its value. Furthermore, the price obtained sufficient demand pressure from below, followed by reversal signs from price action and indicators.
Tezos Key technical points:
- The XTZ coin shows a death crossover of the 50-and-200-day EMA
- The daily RSI chart crossed above the neutral zone(50)
- The intraday trading volume in the Tezos coin is $272.5 Million, indicating a 53.2% gain.
Source- Tradingview
Previously when we covered an article on Tezos, the coin was trying to bounce back from the $3.8 support. However, the price could never breach the nearest resistance of $4.54, and after experiencing strong rejection from this level, it plunged back to the bottom support.
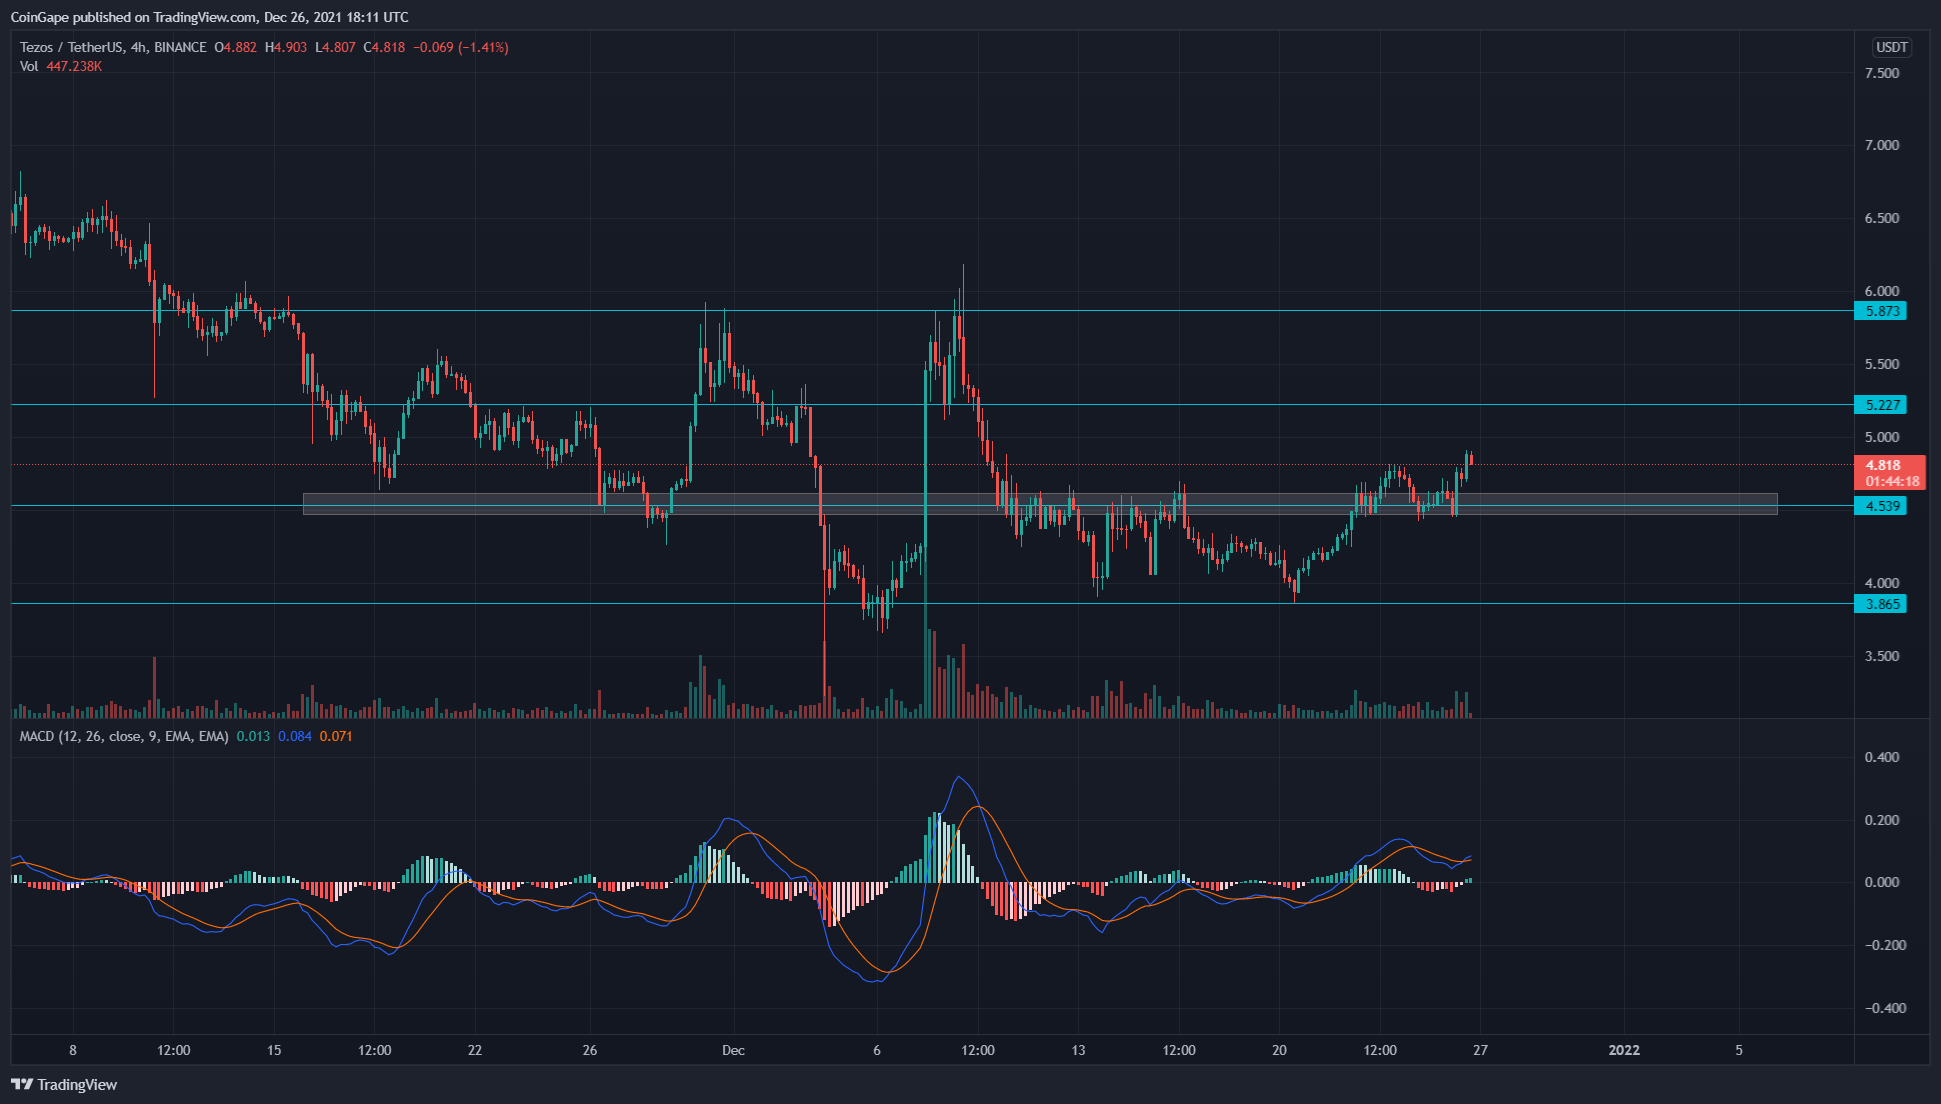
This pair resonated in this level for around two weeks before giving a proper breakout from the overhead resistance on December $23. The price sustains the retest phase the next day, and by forming a morning star candle pattern, it seems ready for an upward rally.
The crucial EMA levels(50, 100, and 200) still indicate a bearish trend for this token. Moreover, the chart has recently shown a death crossover of the 50 and 200 EMA.
The daily Relative Strength Index (62) indicates increasing bullishness in the price with its evident bullish divergence.
XTZ/USD 4-hour time frame chart
Source- Tradingview
For Tezos coin to provide a better confirmation for a new rally, it needs to reclaim the crucial resistance of $5.8. The crypto traders can now expect good support from the $4.5 level, which will bolster the price to rally towards the above resistance.
However, a minor resistance level stands between $5.8, and the price is $5.2. The crypto traders should look out for this resistance as it can offer sufficient resistance to interrupt the new rally.
The Moving average convergence divergence shows both lines moving above the neutral line, indicating a positive outlook for the token. Moreover, the chart also shows a bullish crossover of these lines, indicating a buy signal.


