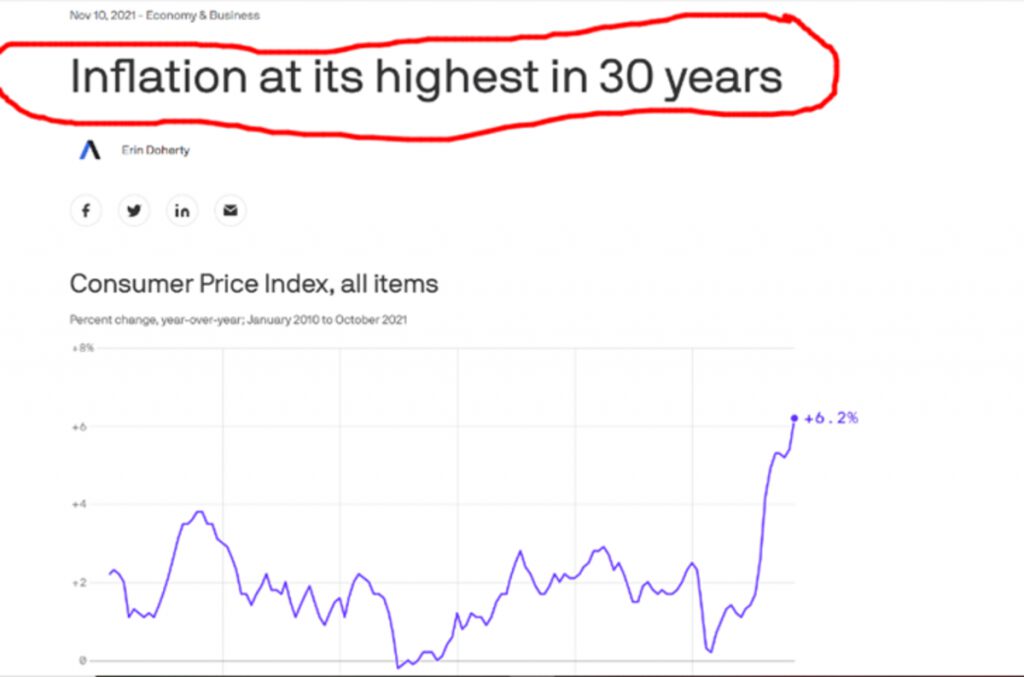
Central banks globally are fighting the deleveraging of the largest debt bubble in modern history. With inflation recently hitting its highest levels in 30 years, many have called for more responsible policy decisions from central banks, to tame the inflation that’s now ravaging the everyday person.
Figure one: Inflation (source)
However, every time central banks attempt to taper and remove artificial stimulus injections into markets, assets begin cratering.
Central banks globally are stuck between a rock and a hard place. Continuing to print and run enormous fiscal deficits will only accelerate the already out-of-control inflation. Meanwhile, every time they stop printing and attempt to raise rates, assets begin selling off precipitously.
Many believe central banks are simply out of options in trying to combat this economic conundrum. Or, do they have a nuclear plan hidden up their sleeves that they’re about to unleash, making the unprecedented 2020 balance sheet expansion look trivial in comparison?
Global Debt Crisis!
Before we look at central banks’ nuclear “solution,” we need to understand why they’d consider such a move and why deleveraging is simply not an option.
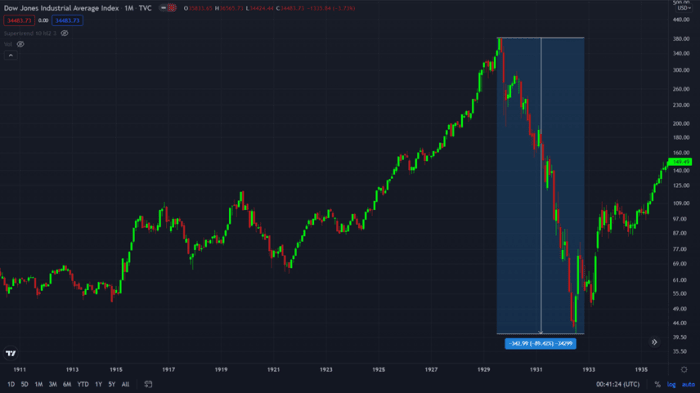
The world has never been more indebted than today in the 2020s, as central banks are trying to avoid a repeat of the mass deleveraging event of the 1930s. The 90% correction in the Dow Jones in 1929 led to a decade-long period of high unemployment, suffering and starvation. The decade in the 1930s is today known as the Great Depression.
At this stage of a long-term debt cycle, with interest rates at zero and debt levels unsustainably high across the globe, central banks’ are desperately hoping to avoid a repeat of the 1930s.
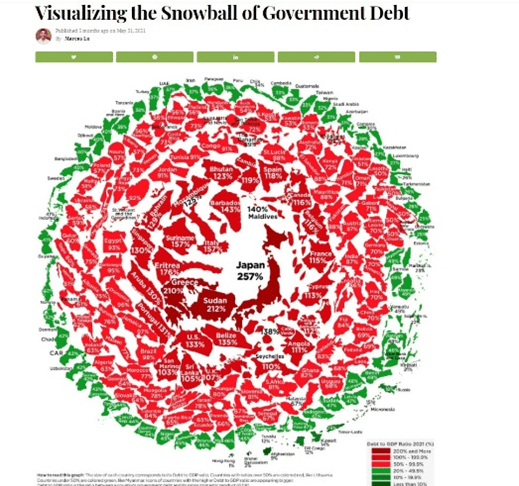
Figure three: Global debt crisis (source)undefined
Hirschmann Capital released a fascinating report which helps to explain the current day predicament facing central banks. Its work showed that since the year 1800, 51 out of 52 countries that have reached sovereign debt levels greater than 130% of GDP ended up defaulting on their debts within 15 years. Default came through either devaluation, inflation, restructuring, outright nominal default or an implicit default, like the one that was seen in 1971 during the Nixon Shock and the U.S. refusing to make good on its obligation to allow countries to redeem the U.S. dollar for the gold it was supposed to be backed by.
In simple terms, central banks normally choose to default through inflation and currency devaluation. They do this by embarking on irresponsible monetary policies, such as money printing, which devalues the currency so that they can pay back their massive debts with the devalued dollars.

Figure four: Hyperinflation (source)
Today, the U.S. has appeared to have crossed the rubicon, having just passed a 130% debt-to-GDP ratio. The previous time in history that the U.S. had debt levels as high as today was in the 1940s, at the conclusion of the previous 75- to 100-year long-term debt cycle. More on this later.
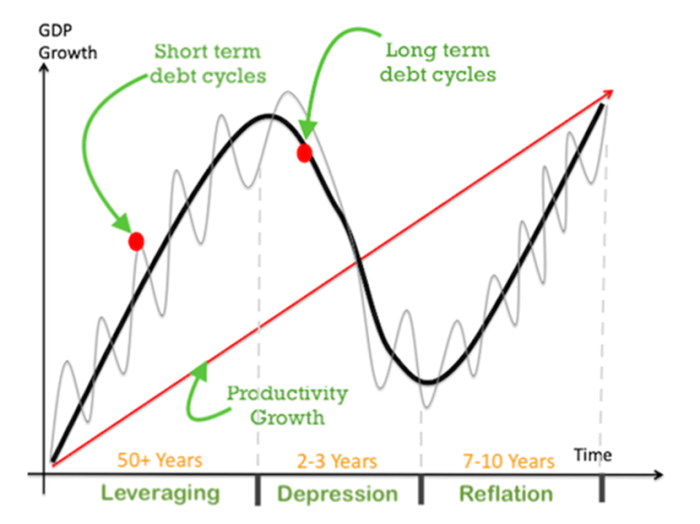
Figure five: The 75- to 100-year long-term debt cycle (source)
The 1930s Blueprint For Central Banks?
Figure six below highlights how the central banks pegged interest rates to 2.5% for the best part of a decade and broke their independence from the government. This separation of the Federal Reserve and U.S. Treasury allowed the government to run large fiscal deficits and enabled it to tackle the enormous debt that was built up through World War I.
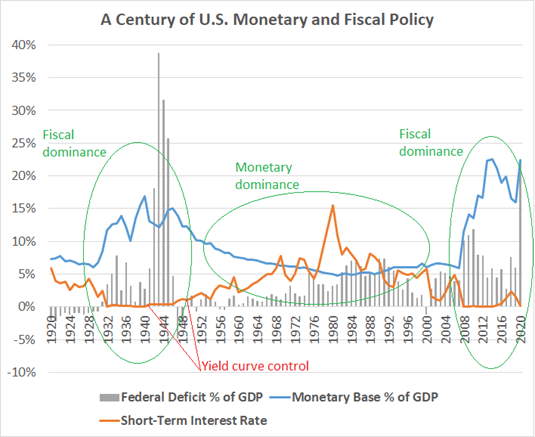
Figure six: Yield curve control in the 1940s (source)
This inevitably caused significant inflation throughout the 1940s, which devalued the currency and enabled the government to decrease its nominal debt/GDP levels from over 120% in 1945, to below 60% by the ’60s, highlighted by figure seven below.
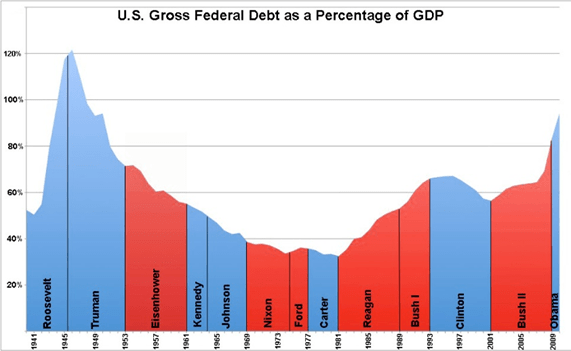
Figure seven: U.S. federal debt/GDP (source)
Is what happened in the 1940s a blueprint that central banks are looking at today?
The International Monetary Fund (IMF), which serves as the central bank of central banks, appears to be well aware of how to deal with the debt. It wrote a working paper titled “The Liquidation Of Government Debt” in 2015, describing how it would use financial repression and inflate away the debt, similarly to what was done in the 1940s. We talked about this paper in more detail in this video.
Every time they try to tell the market that they’re not going to inflate away the debt and taper, the market has a tantrum.
Taper Or Taper Tantrum
Pressure has been mounting on the Federal Reserve to begin tapering, with inflation hitting 30-year highs and central banks around the world in the U.K., Canada and Australia all beginning tapering in Q3 2021.
Recently, Federal Reserve Chairman Jerome Powell begrudgingly announced that the U.S. would begin decreasing the $120 billion in quantitative easing (QE) it has been doing each month. Its plan is to decrease QE by $15 billion per month, which started recently, until it reaches zero in June 2022, when it would also then look to raise interest rates.
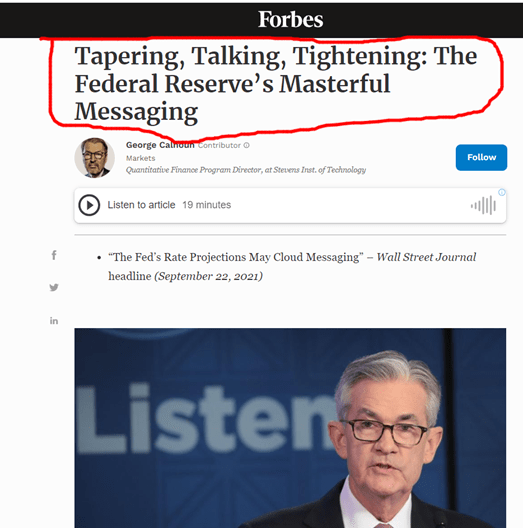
Figure eight, (source)
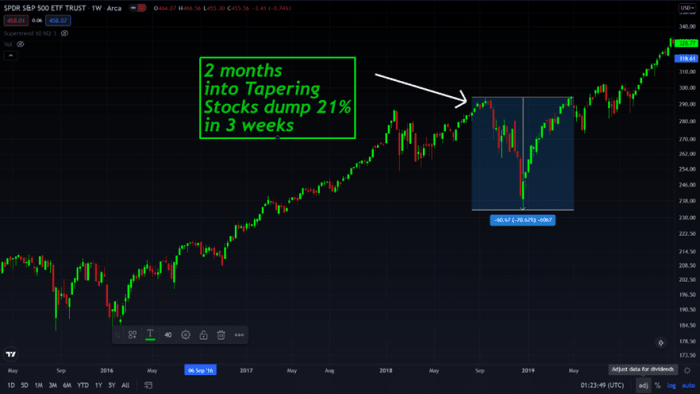
Many involved in the finance and macroeconomic worlds are watching this hawkish move with bated breath. In 2019, Powell tried to taper the Fed’s QE programs and normalize the balance sheet, in an attempt to restore faith in capitalism and the currency after the continued expansionary monetary policy. The unprecedented idea of QE in response to the 2008 Great Financial Crisis was supposed to be temporary, after all. The chart below shows how the stock markets reacted and sold off 22% only two months into tapering, forcing Powell to reverse course and prove that you “can’t taper a ponzi scheme.”
The stock markets are becoming increasingly fragile and reliant on stimulus to remain so artificially elevated. The ever-increasing size of bailouts needed and volatility in markets are vital signs that the currency is coming closer to collapse.
We discussed the concept of currency collapses when talking about German hyperinflation in this video.
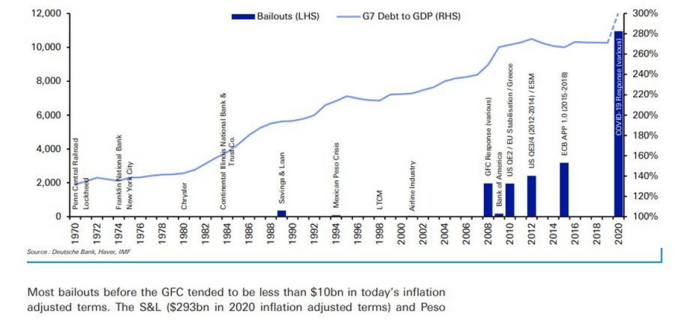
Figure 10: Increasing size of bailouts (source)
This point of increasing fragility and volatility was further illustrated in early 2020 as the SPY, and stock markets globally, had their fastest 30% crash in history. The Fed responded by announcing the largest and fastest bailout in history in response to the global liquidity crisis.
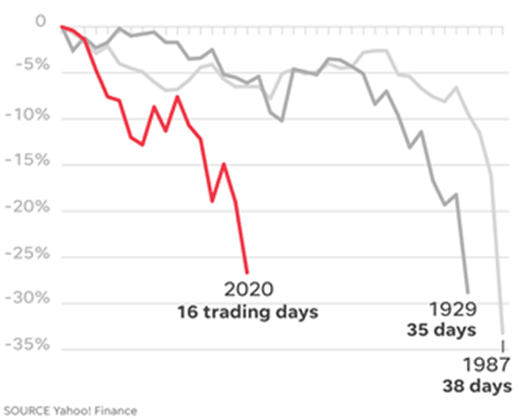
Figure 11: Source
2021 marks the 50th anniversary of the Nixon Shock and we’ve witnessed the unleashing of the most exuberant and unprecedented monetary policies in human history over those 50 years. With debts now at 5,000-year highs and interest rates at 5,000-year lows, what could possibly go wrong when central banks attempt to raise rates?
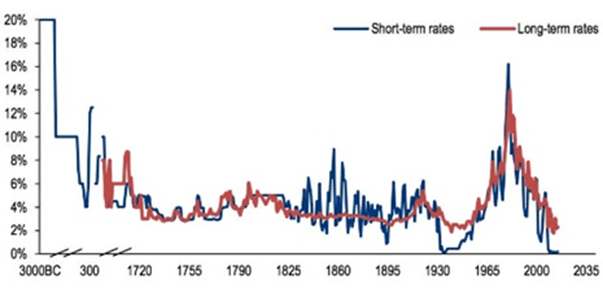
Figure 12: 5,000-year chart of interest rates (source).
Will they taper or are we seeing signs that they’re seeking another avenue through which to tackle inflation?
Nuclear Option… Price Controls?
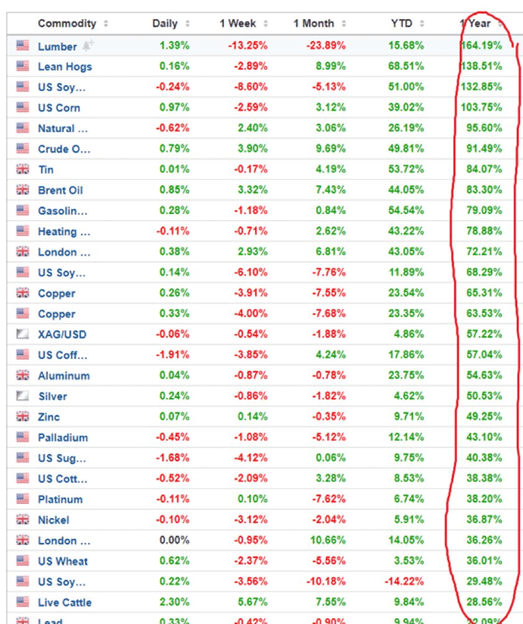
Inflation has to be the most hotly-debated topic in macroeconomics today and the chart below gives insights to why that is.
The recent surge in the price of Thanksgiving costs has also reminded us that inflation is continuing to be a massive issue, and proving to be anything but transitory.
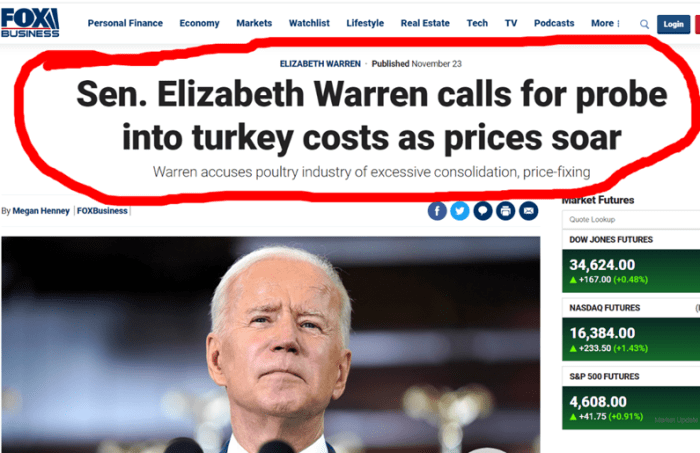
Figure 14: Source
Senator Elizabeth Warren, a former Democratic presidential candidate, recently suggested that consumers are paying higher prices for turkey because of excessive consolidation, price-fixing and “plain old corporate greed.”
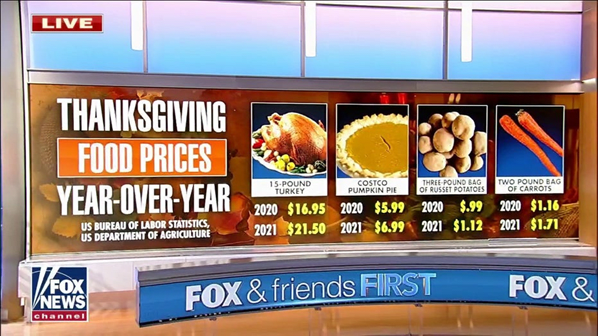
Figure 15: Thanksgiving food prices soaring (source).
“The average cost of this year’s classic Thanksgiving feast has jumped more than 14% from last year’s average, according to the American Farm Bureau Federation’s annual Thanksgiving dinner cost survey. That’s in large part because the cost of a turkey is up nearly 24% from last year. The cost of chicken breasts, meanwhile, has jumped 26% over the past year, according to Labor Department data.”
Other sources claim that the turkey price has increased even more dramatically, which has sparked further heated debate over inflation in the corporate media.
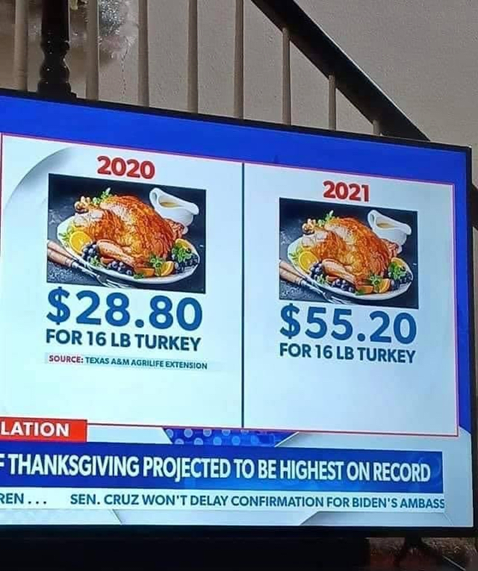
Figure 16: Source
In the same week that Warren went after corporations over inflation concerns, the Food Trade Commission (FTC) said that it was ordering Walmart, Amazon, Kroger and other large wholesalers and suppliers, including Procter & Gamble Co., Tyson Foods and Kraft Heinz Co., “to turn over information to help study causes of empty shelves and sky-high prices.”
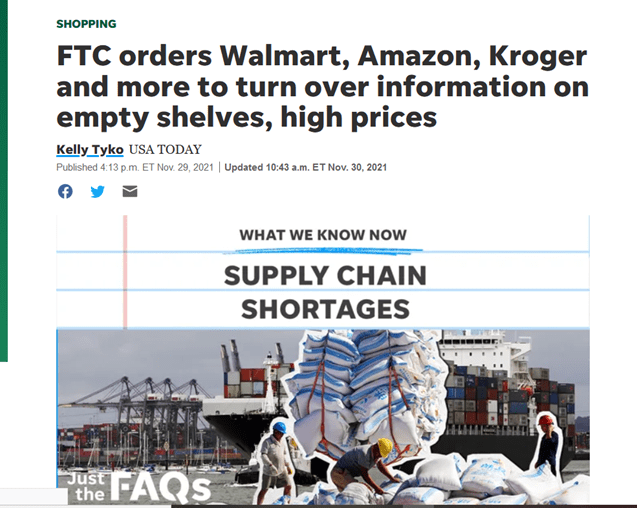
Figure 17: Source
To further flame the food-price inflation debate, a regular contributor to The Washington Post, Micheline Maynard, found the solution to the empty shelves:
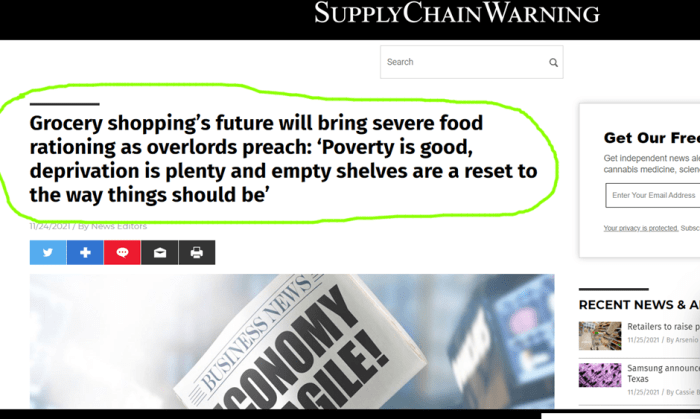
Figure 18: Source
“She says that we have come to expect too much for the economy. Ever since 1911, she says, we’ve been obsessed with getting stuff and getting it fast. That’s dumb, she says. Deprivation is not only the new normal; it’s the way things should be.”
Those words are particularly ominous as we appear to be entering a period of secular inflation akin to the decades of the 1940s or 1970s, when food and energy rationing was normalized in harsh economic environments.
2020s: A Repeat Of 1940s?
Now that Powell has recently ‘’retired the word ‘transitory,’’’ let’s draw from some historically-similar inflationary periods to gauge what we could be in for in the coming years.
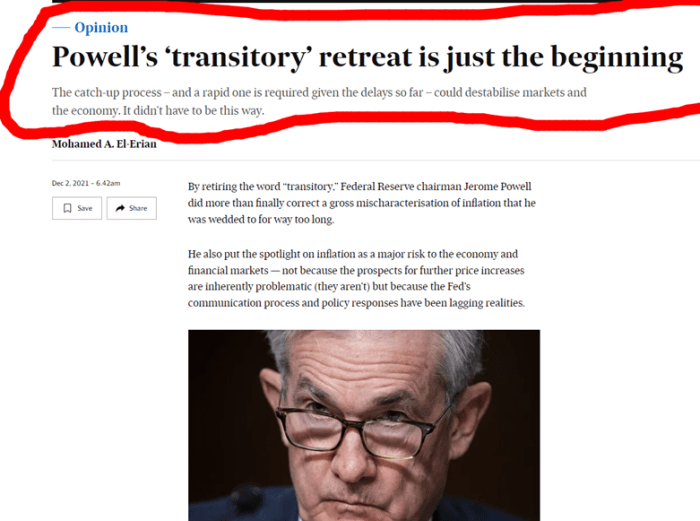
Figure 18: Source
Prices of everyday items were highly volatile during this period of financial repression in the 1940s. Policies like yield curve control (YCC) and heavy fiscal deficits were enforced, as the government attempted to inflate away its debt.
Between 1941 and 1951, total inflation across the CPI inflation basket saw a 76.4% increase, which is a 5.9% annualized inflation rate. The highest yearly inflation print in that time period, which was over 18%, fell between 1946 and 1947.
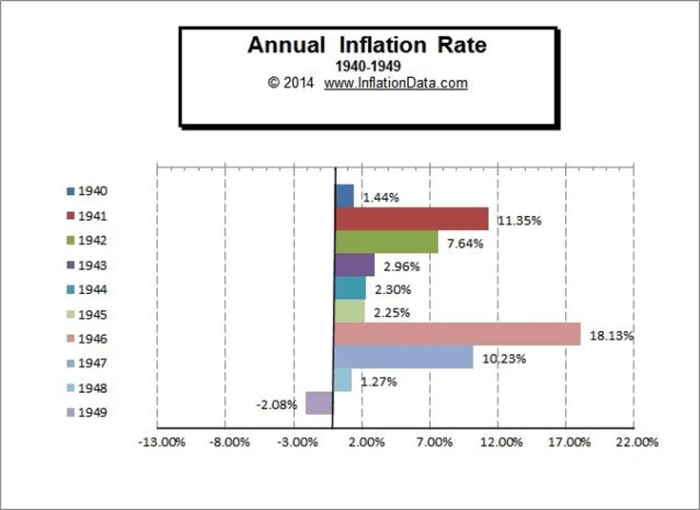
Figure 19: Source
Food was the component in the CPI basket most affected by the volatile inflation and it subsequently saw the largest price increase during this decade, experiencing an 8% annualized inflation rate.
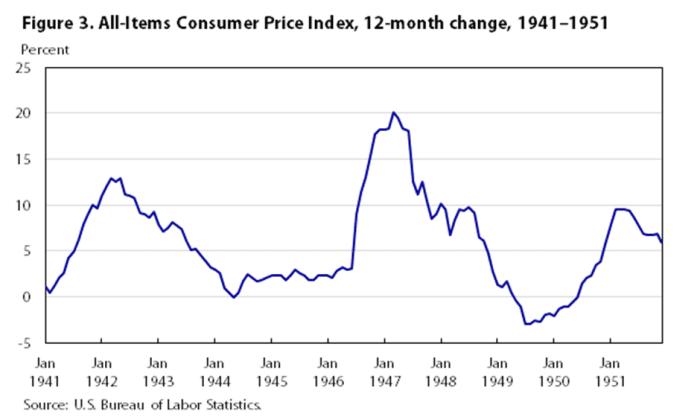
Figure 20: All items in the CPI annualized inflation change from 1941 to 1951 (source)
From January 1941 to May 1943, food was rising at a rapid 18% rate and was similarly volatile between February 1946 and August 1948, experiencing annualized inflation of 19% over the two-year period. Imagine your grocery bill increasing from $100 to $140 in the space of only two years.
In response to the annualized 10% inflation that the U.S. saw in 1941, before the second world war, central planners did what central planners do: The Office of Price Administration (OPA), which became an independent agency in January 1942, was formed to oversee price controls and saw its powers extended and expanded in October of that year with the passage of the “Emergency Stabilization Act.”
The OPA had a busy schedule — many food items, and of course gasoline, were rationed in the early 1940s.

Figure 21: Source
Of course, many items, such as automobiles and radios, were removed from the index and what remained in the CPI basket was heavily manipulated. Shrinkflation was rampant as the CPI index changed the size of a box of corn flakes from 8 ounces to 6 ounces, and many automobile measurements were changed to try and hide the inflation that the public felt during this period.
The price controls were temporarily lifted in 1946, only to be once again called upon in 1951. Both times that price controls were implemented, it only led to food shortages as producers had no incentive to produce large crops when their profits were cut and more pain was felt by the consumer as a result. Inflation only began to dissipate in the early 1950s as a result of the Fed’s tighter monetary policy.
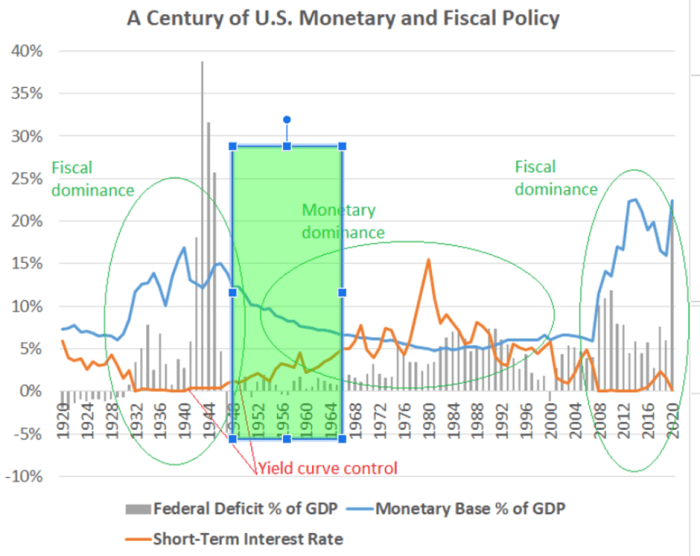
Figure 21: Source
Interest rates were allowed to rise and large fiscal deficits begun to decrease in the early ’50s. The decision to enforce tighter monetary policy also coincidentally led to 15 years of low inflation, highlighted by the green shaded box above in figure 21.
Oil Shortages And Oil Price Fixing
The FTC has had a busy end of year. It has not only been investigating food inflation and putting pressure on food corporations and monopolies like Walmart and Amazon, as we discussed earlier, but the energy producers are also under fire.
President Joe Biden is asking the Federal Trade Commission to look into behavior from energy companies as gas prices hover around a seven-year high.
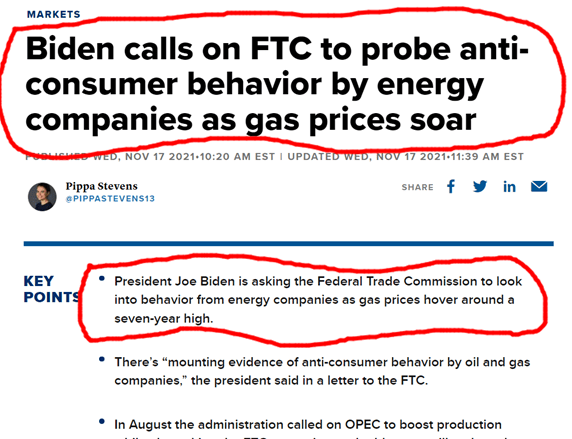
Figure 22: Source
The national average for a gallon of regular gas stood at $3.41 a month ago, according to data from AAA. That’s up from $2.16 as of one year ago.
Fuel prices aren’t just soaring in the U.S. The entire world is experiencing an energy crisis, as figure 23 below shows that energy prices in Iceland are up over 300% in the last year. The majority of Europe is in the same boat with electricity prices doubling since 2020.
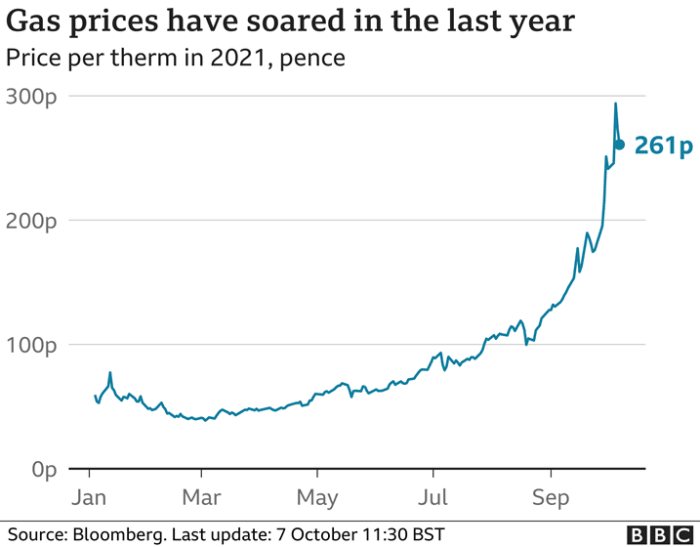
Figure 23: (source)
The American Petroleum Institute called Biden’s calls on the FTC a “distraction from the fundamental market shift.”
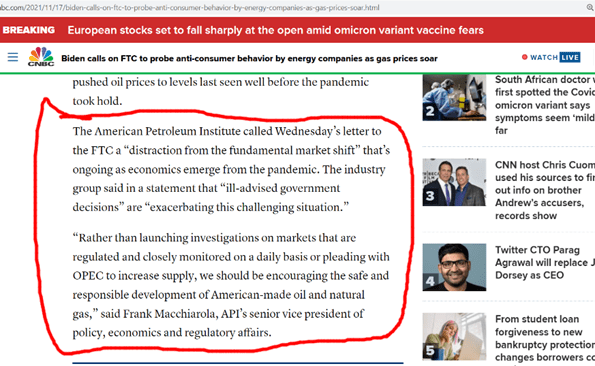
Figure 24: Source
“The American Petroleum Institute called Wednesday’s letter to the FTC a ‘distraction from the fundamental market shift’ that’s ongoing as economics emerge from the pandemic. The industry group said in a statement that ‘ill-advised government decisions’ are ‘exacerbating this challenging situation.’
‘Rather than launching investigations on markets that are regulated and closely monitored on a daily basis or pleading with OPEC to increase supply, we should be encouraging the safe and responsible development of American-made oil and natural gas,’ said Frank Macchiarola, API’s senior vice president of policy, economics and regulatory affairs.”
–CNBC
But what is he talking about and why is there a shortage of oil?
Well, you see, it’s Biden policies that are causing the oil shortage, which we covered in more detail in this video. In the same way that it was the expansionary monetary policy in the 1940s that caused the significant inflation in that era, massive fiscal deficits and poor policy decisions are similarly causing the inflation today.
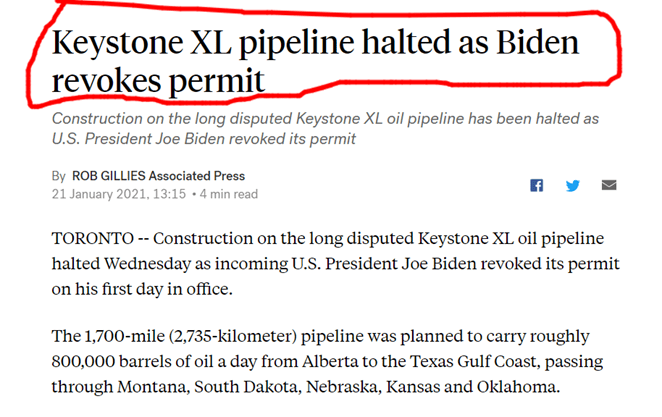
Figure 25: Source
Biden, and policy makers globally, are creating the perfect recipe for explosive inflation. Firstly, through over regulation, they’re causing serious supply shortages and then, by creating excess demand in the form of new money through irresponsible QE and fiscal spending, prices were always destined to rise.
Now all of Biden’s attempts to heavily regulate the oil industry have led to a 10% decrease in oil production in 2021.
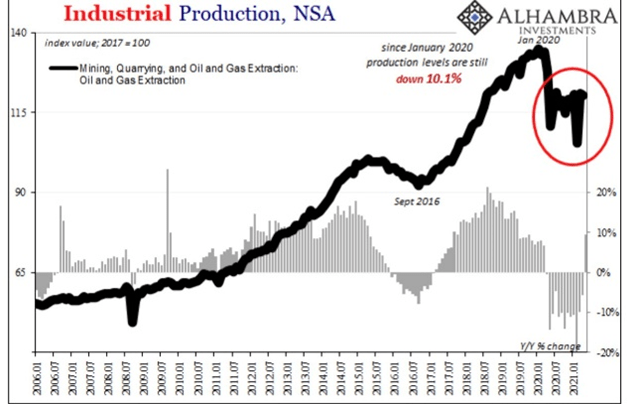
Figure 26: Source
12.2 million barrels of oil per day were produced in 2019 and today, only 11.7 million barrels are being produced. That’s a 10.6% decline in production which is the largest annual decline on record.
Americans alive today who lived through the oil and energy crisis of the 1970s don’t have fond memories of those times, as they know all too well the devastating effects of over regulation.
Earlier, we explored the inflationary decade of the 1940s and all of the price controls exercised in response. However, the inflation of the ’40s pales in comparison to the inflationary decade of the 1970s, and in response, the subsequent price controls were even more exuberant from our central planners in the ’70s.
Inflationary 1970s Food And Energy Rationing
Inflation remained very tame and low through the 1950s until the late 1960s, until the Federal Reserve began running fiscal deficits which it accelerated in size around 1966 to continue funding the Vietnam War.
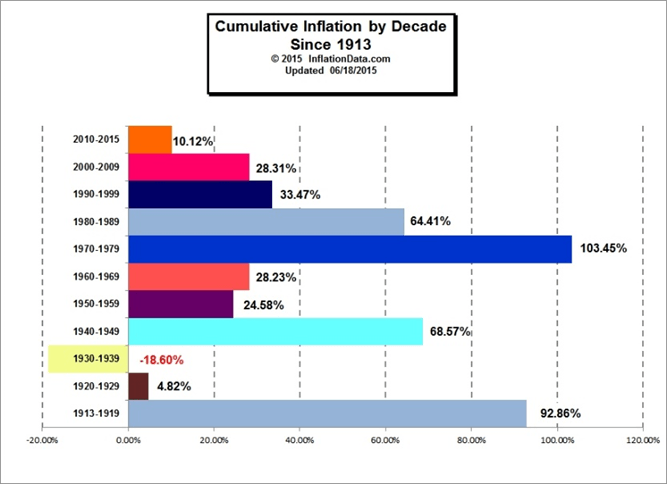
Figure 27: Cumulative inflation by decade (source)
The period of time around 1966, when the Fed began spending more than it received in tax receipts, is highlighted below in figure 28.
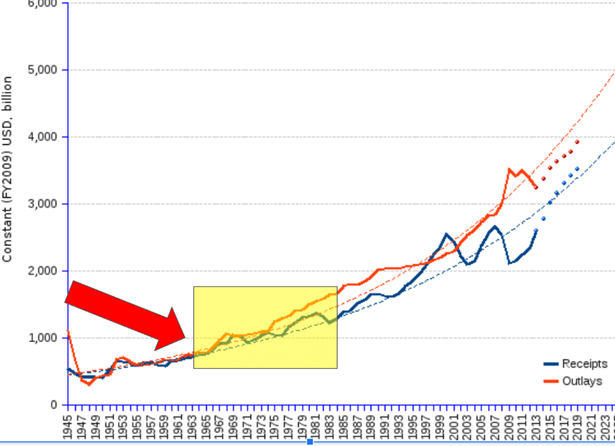
Figure 28: Source
Subsequently, all Items in the CPI saw a total increase of 186.4%; or 7.3% inflation annually through the years of 1968 to 1983. The inflation of the late ’60s was a warning sign, which ultimately ended with the Nixon Shock, as mentioned above, which only accelerated inflation throughout the decade. Nixon actually won re-election in 1972 based upon his promise to implement price controls in an attempt to slow down inflation.
Nixon introduced a 90-day price freeze on all wages and prices in the economy in 1971, trying to combat the rampant inflation.
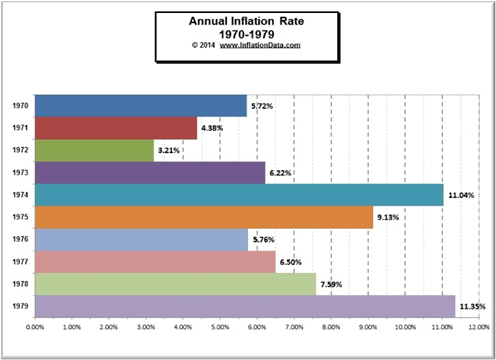
Figure 29: Source
In the ’40s, it was food that was heaviest hit by inflation. This time, in the ’70s, it was oil being the driving force behind the rampant inflation.
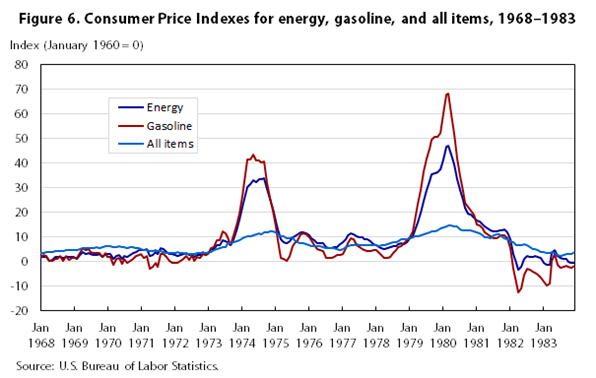
Figure 30: Gasoline and inflation soaring in the ’70s (source)
Nixon issued Executive Order 11615 (pursuant to the “Economic Stabilization Act of 1970”), imposing a 90-day freeze on wages and prices in order to counter inflation.
In 1973, gasoline consumption by Tulsa city vehicles was cut more than 25% to preserve gasoline, and some workers lost their vehicle take-home privileges. Lightbulbs were removed from corporate buildings leaving workers in the dark and speed limits were lowered to 55 miles per hour in an attempt to preserve the scarce petroleum. Only the police and fire departments were exempt from rationing, leaving everyone else fighting over the limited supply.
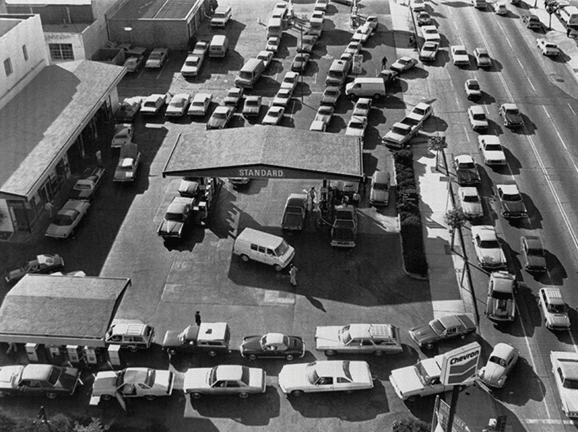
Figure 31: Gas shortage in the ’70s (source)
This morbid video highlights some of the consequences to the price controls that occurred in the 1970s. Price controls on chickens, coupled with the rising cost of chicken feed, meant it was uneconomical for farmers to feed their chickens, leading to large swaths of livestock being wasted.
This article written by Stephen Roache, who was a Fed insider in the 1970s, explains how the Consumer Price Index (CPI) inflation basket was manipulated throughout the 70s. Countless items such as energy, food and housing were all systematically removed from the official CPI inflation basket and by the end of the decade, 75% of the items in the original basket at the beginning of the 1970 had been removed.
All of these price controls and overreaching government actions had no effect on stopping the inflation. It only caused shortages and black markets to emerge, which both wreaked havoc on the economy. The only thing that tamed inflation was more responsible monetary policy, highlighted below in figure 32. In 1981, Paul Volcker finally slowed down inflation after raising interest rates to 20%, in a desperate attempt to put an end to the most inflationary decade in U.S. economic history.
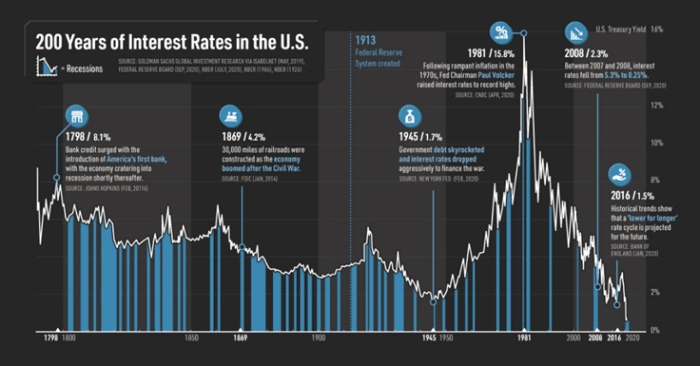
Figure 32: 200 years of interest rates (source)
Notice the common theme that stopped rampant inflation in both the 1940s and the 1970s? Responsible monetary policy decisions. Price controls and further regulation failed in both decades and concerningly, policy makers at the helm today in the 2020s appear ignorant to history.
Price Controls Making A Comeback In The Great Inflationary Decade Of 2020s?
Are these recent suggestions and recent inquiries from Biden, Warren and the FTC clues that rent controls weren’t the first signs of policy makers planning on becoming a larger part of our economy in the near future?
Oregon and California were the first states in the U.S. to begin the trend of using rent controls in 2019, in an attempt to tackle housing affordability. Oregon introduced a statewide law that capped homeowners from raising their rents by 7% plus inflation, and California followed suit, introducing a 5%-plus-inflation-rent-increase cap on homeowners.
This trend of homeowners being blamed continued in early 2020, with the introduction of a housing moratorium for renters. Many lost their jobs as a result of the government mandated lockdowns and subsequently were unable to pay their rent.
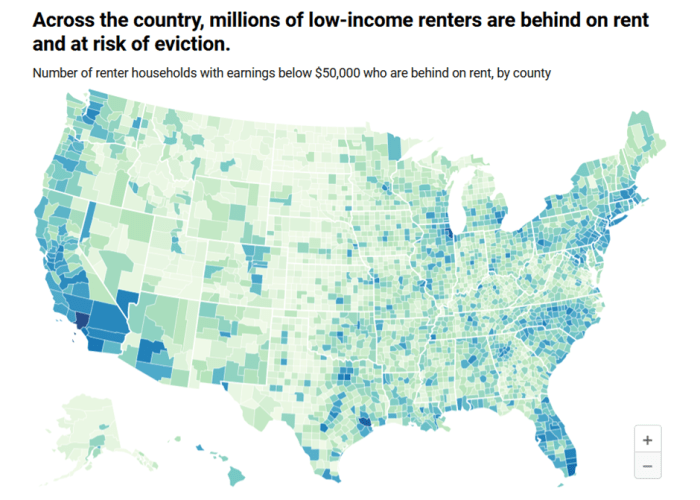
Figure 33: Source
As of mid-August 2021, 5.9 million renter households, 15% of all renters, were behind on their rent payments.
Again, the unaffordability of houses is a consequence of low interest rates and central banks globally continuing to engage in QE. The Fed now owns around 30% of the total mortgage-backed security market in the U.S.
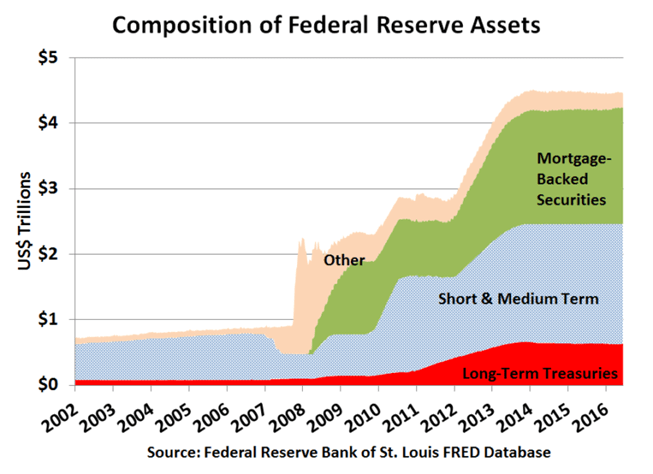
Figure 34: Fed balance sheet (source)
The trend of more central planning in the U.S. seems to be accelerating of late, as Joe Biden, Elizabeth Warren and the FTC have all been calling for more government control in the last handful of weeks alone.
Central planning always fails, and one simple chart helps to explain this phenomenon:
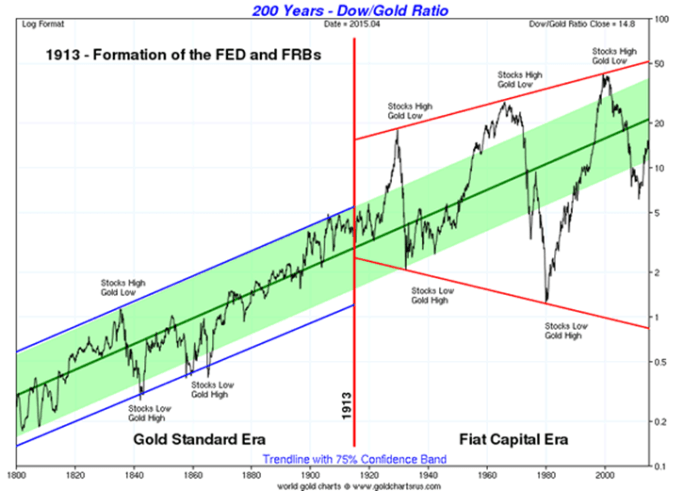
Figure 39: Source
Central banks claim their interference with the free market helps to smooth the business cycle. However, it’s very clear that since 1913, and the creation of the Fed, markets have only continued to get more and more volatile.
In each occasion that there was a slowdown in the short-term business cycle, the next crash is becoming larger and faster than the previous one. You can’t remove volatility from the markets, you can only push it further into the future, where it’s effects are compounded by magnitudes when they eventually arrive.
And the more that the central bankers try to fix things, the worse they become.
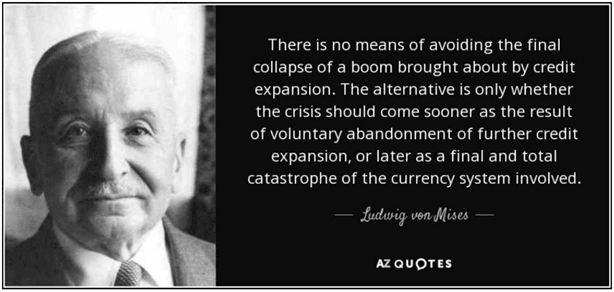
Figure 36: Source
In a recent video, we discussed what the final stages of what von Mises called the ‘’crack-up boom’’ generally looks like.
“The course of a progressing inflation is this: At the beginning the inflow of additional money makes the prices of some commodities and services rise… There are still people in the country who have not yet become aware of the fact that they are confronted with a price revolution which will finally result in a considerable rise of all prices… These people still believe that prices one day will drop. Waiting for this day, they restrict their purchases and concomitantly increase their cash holdings…
But then, finally, the masses wake up. They become suddenly aware of the fact that inflation is a deliberate policy and will go on endlessly. A breakdown occurs. The crack-up boom appears. Everybody is anxious to swap his money against ‘real’ goods, no matter whether he needs them or not, no matter how much money he has to pay for them.
Within a very short time, within a few weeks or even days, the things which were used as money are no longer used as media of exchange. They become scrap paper. Nobody wants to give away anything against them.”
And this time is coming fast. Trust is a very fickle thing, and once it is lost, it is gone for good. Currently, trust is being lost in currency at an accelerated pace.
A recent survey with 11,000 participants in 76 countries found that 41% of people globally say they trust bitcoin over local currencies:
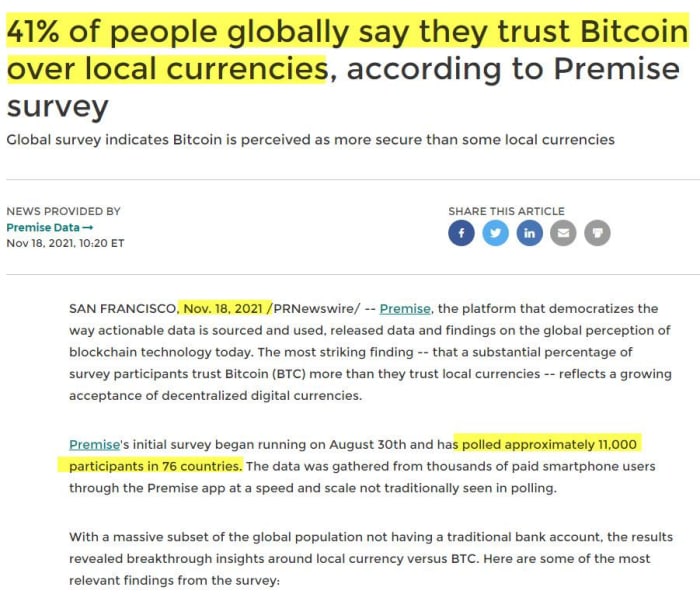
Figure 37: Source
The time to buy insurance for your house is “before” the fire comes. And the time to protect yourself from the Federal Reserve induced “crack-up boom” by moving your wealth from cash to bitcoin is before the crack-up boom happens. Because once it happens, it will be too late.
The good news is you still have time, stack accordingly.
Additional Resources:
- “Biden Halts Oil And Gas Leases, Permits On U.S. Land And Water”
- “Why is Biden Halting Federal Oil And Gas Sales?”
- “Keystone XL Pipeline Halted As Biden Revokes Permit”
- “Biden Might Close Michigan Pipeline, WH Admits After Calling Report Bogus”
- “White House Confirms Biden Effort To Shut Down Another Major Pipeline”
- “Biden Shutting Down Line 5 Pipeline Could Send Gas Prices Surging”
- “Biden: OPEC And Russia Must Pump More Oil To Help America’s Working Class”
- “Biden’s Energy Idiocy: Kneecap U.S. Oil But Beg OPEC To Pump More”
- “U.S. Shale Has A Message For The Biden Administration: Ask Us To Increase Oil Production, Not OPEC”
This is a guest post by Mark Moss. Opinions expressed are entirely their own and do not necessarily reflect those of BTC Inc or Bitcoin Magazine.

