(Source)Watch This Episode On YouTube
Listen To This Episode Here:
“Fed Watch” is a macro podcast, true to bitcoin’s rebellious nature. Each episode, we question mainstream and Bitcoin narratives by examining current events in macro from across the globe, with an emphasis on central banks and currencies.
In this episode of “Fed Watch,” Christian Keroles and I go through several charts, using them to springboard into different topics. We cover the bitcoin chart, the U.S. dollar, the Hong Kong dollar, U.S. Treasury yields and energy charts like oil, gasoline and natural gas.
Bitcoin And Other Currencies
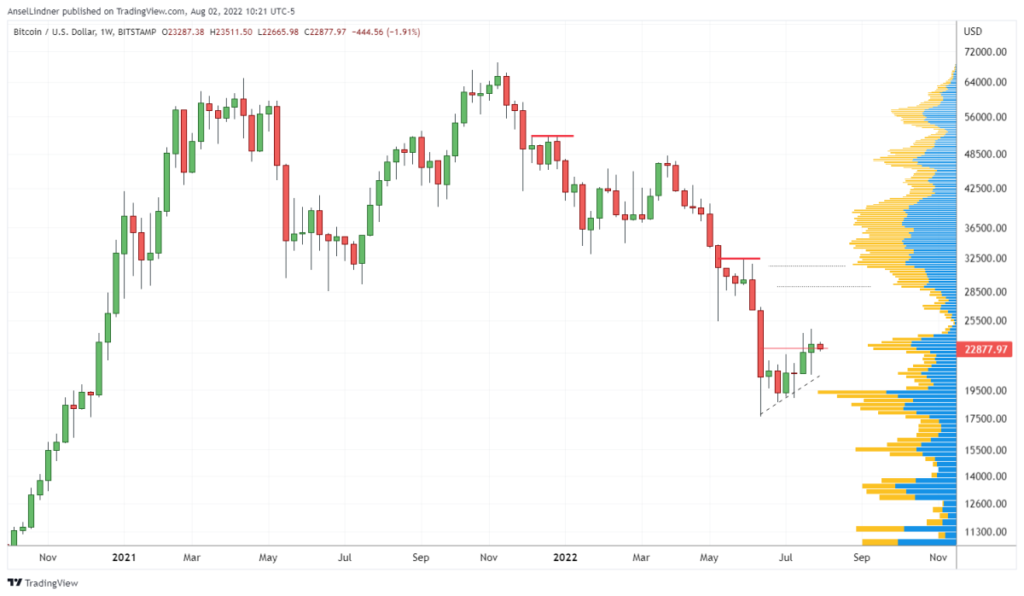
We start our discussion with a very simple chart of the bitcoin price. The indicator on the right is volume-by-price, and it shows the trade volume at each price level. This volume tends to attract bids and asks like a Schelling point. I expect the price to move up into the low-volume gap in the mid-$20,000s.
(Source)
(Source)
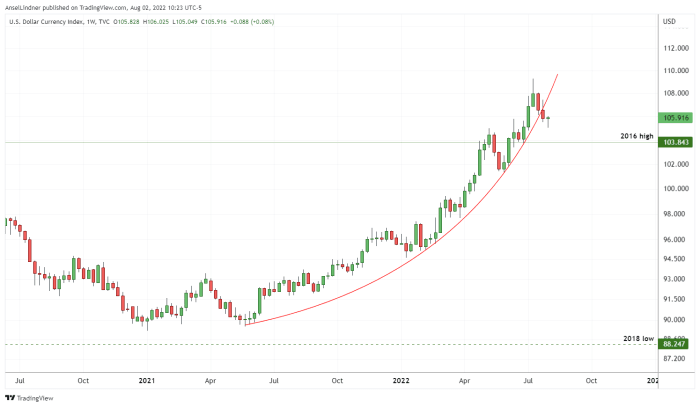
Next is the U.S. dollar, and this is where the “Fed Watch” podcast has been way ahead of the curve. We’ve been saying the dollar will strengthen during all of 2021, while most others in Bitcoin and macro were screaming about a dollar crash.
As you can see on the chart, the dollar has broken its recent parabolic trend, signaling its rise will likely slow into a period of consolidation.
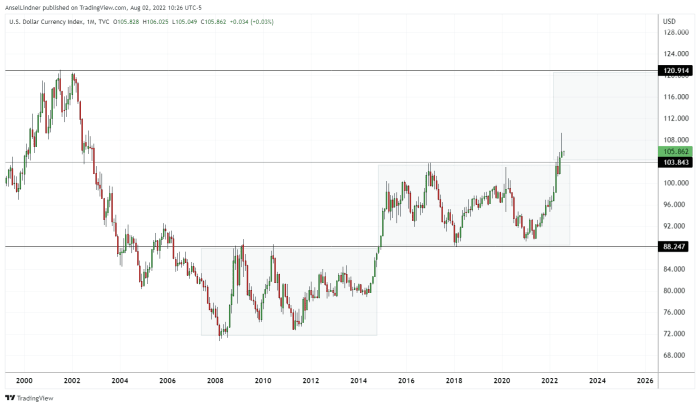
Below is a monthly long-term chart of the dollar index (DXY). I’ve added shaded boxes to indicate a stair-step upward move in the dollar post-Global Financial Crisis (GFC). I expect the dollar to move into the next higher range over the coming years.
(Source)
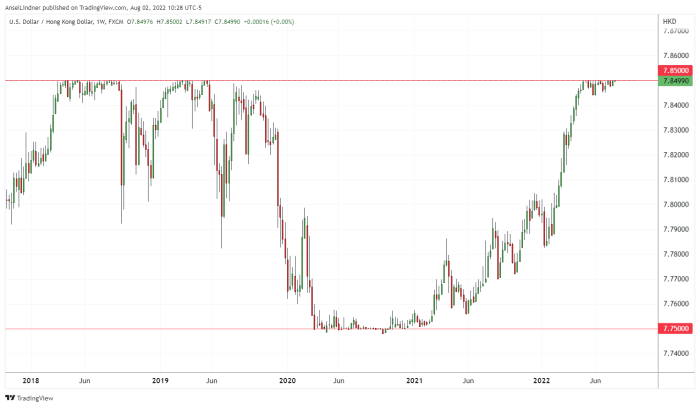
I included a chart of the Hong Kong dollar (HKD) to demonstrate the currency pressure in China. As you can see, it is at the top of the range, meaning the HKD wants to depreciate against the dollar, but the Hong Kong Monetary Authority is using its U.S. dollar reserves to buy HKD instruments in order to keep the peg.
(Source)
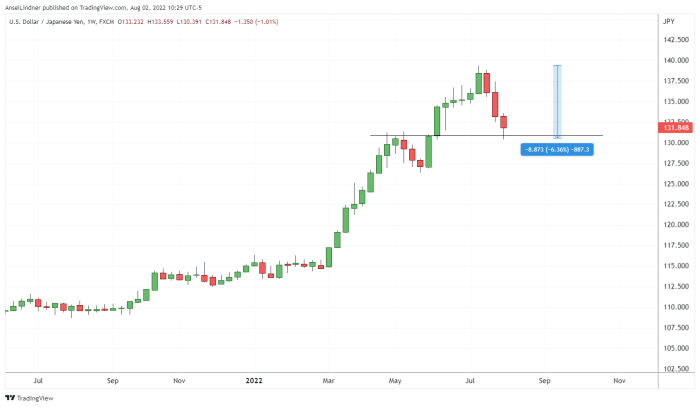
The last currency chart we have is the Japanese yen (JPY). It is currently 6% off its recent low against the dollar (on this chart, the yen falling is shown as the dollar strengthens).
One fascinating thing I point out on the podcast is that the very top of the chart corresponds to the Japanese elections they just had. These recent elections also saw the very unusual assassination of Shinzo Abe. That is two very unusual events around the election: crashing yen and the assassination of a popular leader.
The result of the election was that the conservative party marginally increased their number of seats in the government. On the podcast, I speculate about the conservative versus globalist perspective of these unusual events surrounding the election.
(Source)
U.S. Treasury Yields
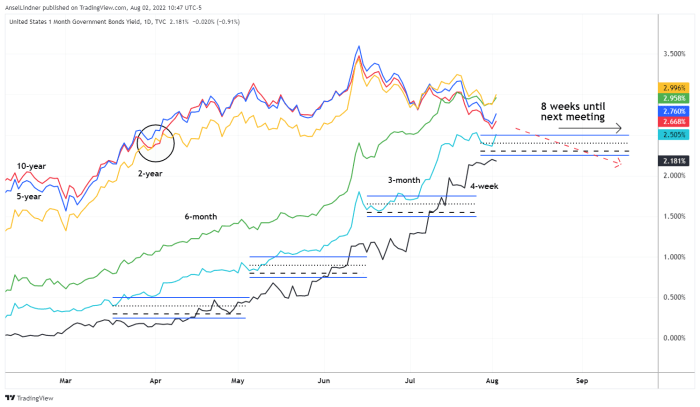
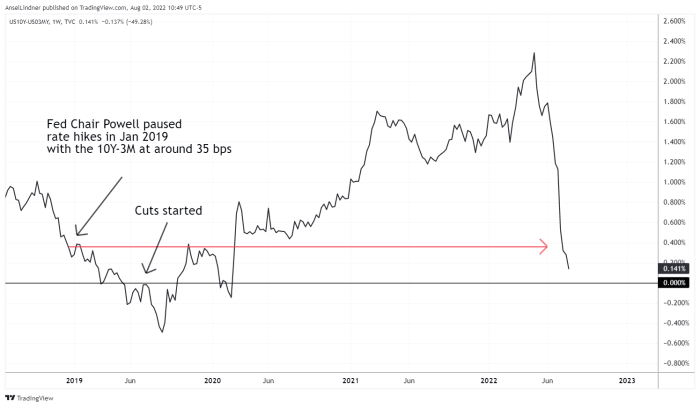
We quickly take a look at the two charts below and have a discussion about yield curves and what they could be telling us right now.
(Source)
(Source)
Everyone is so enamored by the Federal Reserve, fully believing in its mythological powers. However, you would understand the macro economy better if you forgot the Fed existed at all and simply looked at the charts to see what they are trying to tell you.
Yields and inversions are telling us that the largest, most sophisticated market in the world is increasingly and rapidly hedging against a near-term risk. As the curves approach zero (see the second chart above) and eventually go negative, the probability of an acute credit event is becoming more and more likely.
Energy Charts
A large portion of the rise in the consumer price index (CPI) is due to energy prices and supply shocks. On the podcast, we breakdown U.S. oil and gasoline, then European natural gas.
(Source)
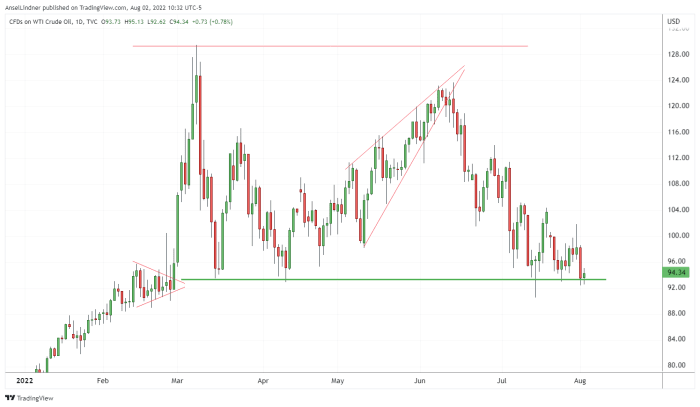
The above chart is West Texas Intermediate (WTI) oil. As you can see, it is right on support. If it breaks lower here, we could see a fall into much lower levels.
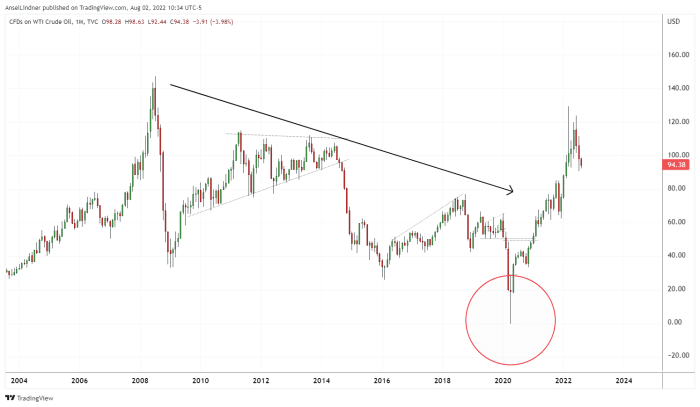
Next, taking a look at the long term WTI price chart (below), you see that the recent spike did not match the spike from the GFC. Historical support sits below the current price at around $75-80 per barrel.
(Source)
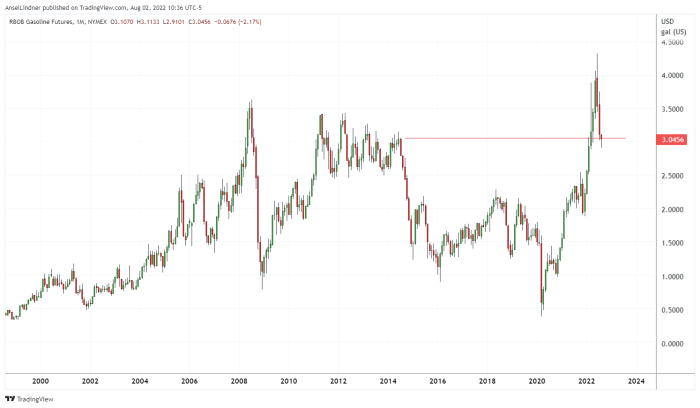
U.S. gasoline futures, however, did reach a new high this time, when compared to the GFC. Despite this, it too has pulled back and is threatening to drop lower.
The moral of this energy story in the U.S. is that global demand is shrinking while global supply is relatively stable. Even U.S. production is stable and growing, despite the attempts by the current administration to humble the energy industry.
(Source)
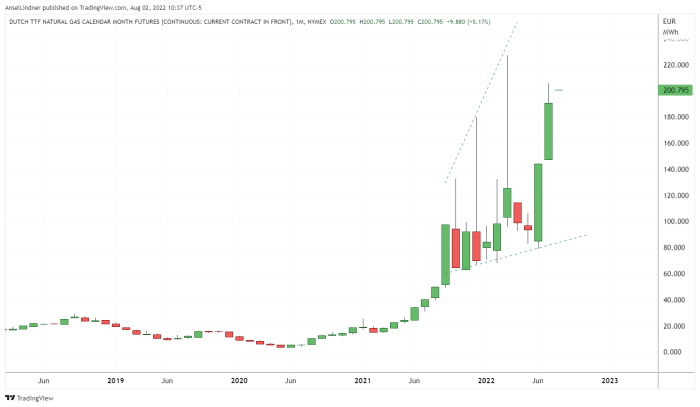
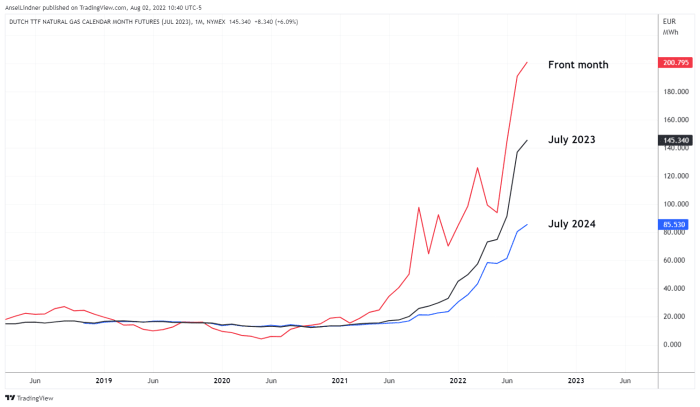
The next two charts we covered on the podcast briefly. They are both European natural gas futures; Dutch contracts, to be specific.
(Source)
(Source)
I pointed out during the episode that the July 2023 contract is now above where the current price was just a couple months ago. Things can obviously change before the middle of 2023, but what this chart is telling us is if nothing changes soon, crippling energy prices will only continue for Europe. The ball is in the globalists’ court.
Russian Sanctions Soften
The heat is being turned up on the globalists sanctioning Europe. In the podcast, I read through a recent article from the Financial Times, that goes through how the recent sanctions package from July effectively removes many of the sanctions. Once again, objective reality wins and the fake reality sold to us by the globalists is falling apart.
“European governments have eased back on efforts to curb trade in Russian oil, delaying a plan to shut Moscow out of the vital Lloyd’s of London maritime insurance market and allowing some international shipments amid fears of rising crude prices and tighter global energy supplies. […]
“However, the EU has amended part of its own sanctions to permit European companies to deal with some Russian state-owned entities, such as Rosneft, for the purpose of transporting oil to countries outside the bloc.
“European companies will no longer be blocked from paying the likes of Rosneft, ‘if those transactions are strictly necessary,’ for the purchase or transport of crude or petroleum products to third countries, a European Commission spokesperson told the FT.
“The EU said in a statement that the measures were taken to ‘avoid any potential negative consequences for food and energy security around the world.’”
Nancy Pelosi’s Taiwan Trip And China’s Bluff
“Fed Watch” is no fan of the current globalist administration in the U.S., however, Representative Pelosi’s trip to Taiwan brings up some important nuances to the current geopolitical chessboard.
China is the biggest beneficiary of globalization today. If you are on the side of the people against the globalists and statists, you would have to be against the Chinese Communist Party (CCP). Also, in this specific incident, the U.S. is playing the role of the anti-globalist power because through the world’s current perverse geopolitical incentive structure, backing Taiwan is the populist move.
The lasting effect of Pelosi’s trip is going to be the humiliation of the CCP. Before she went, I said on several occasions that the tough rhetoric from China showed they were actually unable to do anything about it. The “Art of War” says to look strong where you are weak. So, the CCP ramped up their aggressive rhetoric to look strong. The U.S. called its bluff.
Other ramifications of this move include the bolstering of the U.S.’s greatest ally in the region, Japan, the arch-rival of China.
That does it for this week. Thanks to the readers and listeners. If you enjoy this content please subscribe, review and share! Don’t forget to check out the Fed Watch Clips channel on YouTube.
This is a guest post by Ansel Lindner. Opinions expressed are entirely their own and do not necessarily reflect those of BTC Inc. or Bitcoin Magazine.

